| StockFetcher Forums · Filter Exchange · Price above EMA(13) filter. | << 1 ... 2 3 4 5 6 >>Post Follow-up |
| graftonian 1,089 posts msg #128753 - Ignore graftonian |
5/26/2016 2:34:54 PM 90 Minutes to go PBI or WAC? |
| ThaGekko 139 posts msg #128754 - Ignore ThaGekko |
5/26/2016 2:43:24 PM AA still holding EMA(13). Hopefully can close above. |
| pthomas215 1,251 posts msg #128758 - Ignore pthomas215 |
5/26/2016 3:23:25 PM graft, I think there are more bullish picks on a short term basis then those 2. as usual Mac has another insightful point. try looking at EMA(5) crossing above EMA(13) today and charts look pretty good. also price moving above MA(50) as Mac points out. |
| ThaGekko 139 posts msg #128759 - Ignore ThaGekko modified |
5/26/2016 3:31:33 PM not many stocks show up above MA(50) when added to the first filter. Maybe 1-2 a week? I understand possibly waiting for EMA(5) crossing the EMA(13), but waiting for move above the MA(50) and you've missed a big part of the run IMO. |
| pthomas215 1,251 posts msg #128765 - Ignore pthomas215 |
5/26/2016 4:05:43 PM you are correct. Missing the run up is common in looking for that parameter. I have been looking lately at cci metrics, estimating the cross over. i am doing this to catch the run up before it starts. |
| ThaGekko 139 posts msg #128766 - Ignore ThaGekko modified |
5/26/2016 4:11:20 PM Have you looked at four's analysis of CCI(61) & CCI(10)? $AA was able to close above the EMA(13) and the EMA(13) increased again today. EMA(5) is extremely close to EMA(13). I think I got in before confirmations were made on this one, but hopefully it works out... otherwise it have only $100. |
| shillllihs 6,102 posts msg #128767 - Ignore shillllihs |
5/26/2016 4:11:48 PM The problem with this ema13 thing is, it catches rallies late, it gives too much back & there are false starts. Not downing it but these are the facts. Either augment it or scrap it in favor of Williams or IFT. |
| ThaGekko 139 posts msg #128768 - Ignore ThaGekko |
5/26/2016 4:14:03 PM shillllihs does this filter not incorporate both? |
| Mactheriverrat 3,178 posts msg #128770 - Ignore Mactheriverrat modified |
5/26/2016 4:34:58 PM Submit How's that shillllihs does that put you in better mood. |
| Mactheriverrat 3,178 posts msg #128771 - Ignore Mactheriverrat |
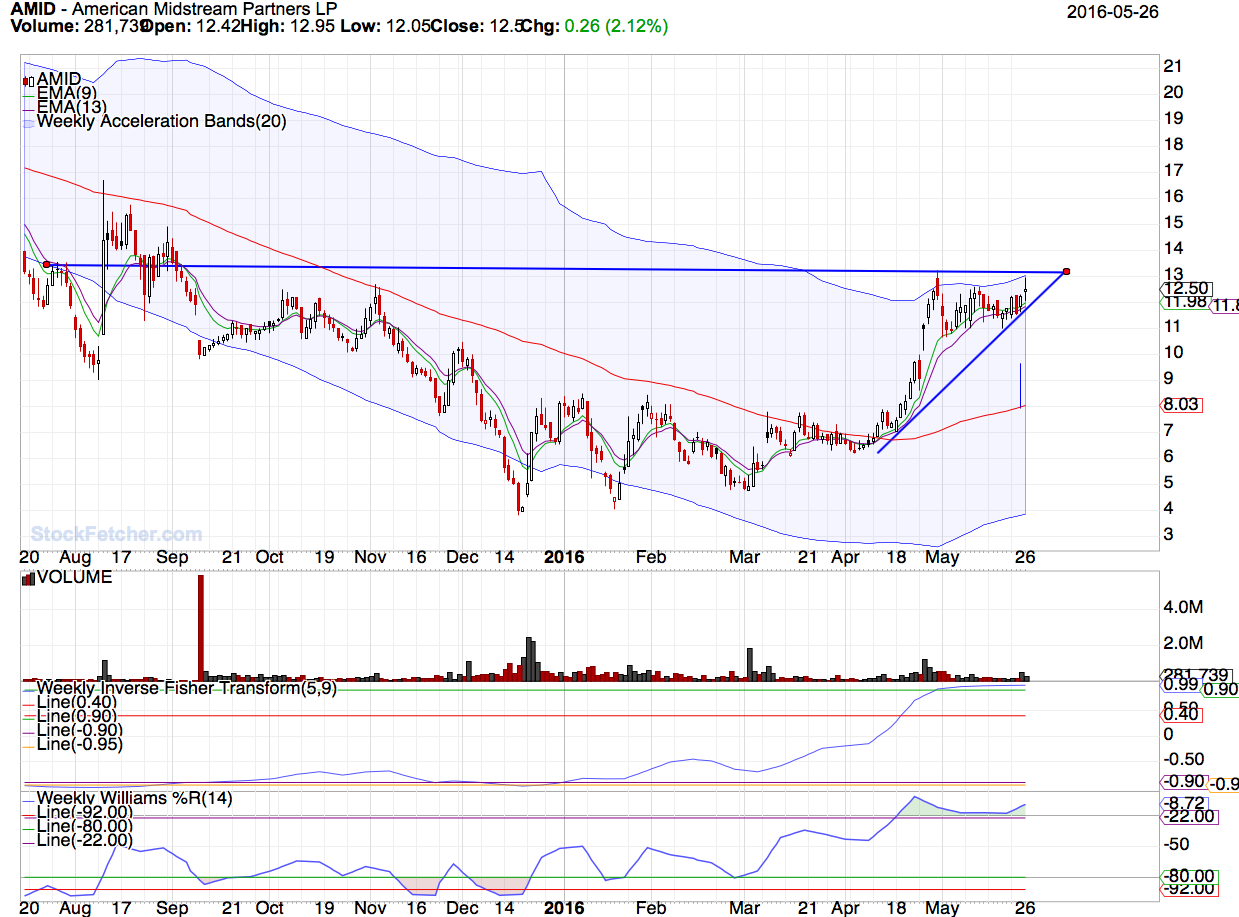
5/26/2016 4:44:39 PM Looking for breakout of AMID  |
| StockFetcher Forums · Filter Exchange · Price above EMA(13) filter. | << 1 ... 2 3 4 5 6 >>Post Follow-up |