| StockFetcher Forums · Stock Picks and Trading · PEP, of interest? | << 1 2 >>Post Follow-up |
| four 5,087 posts msg #118225 - Remove message modified |
2/18/2014 10:44:52 AM LONG 78.16 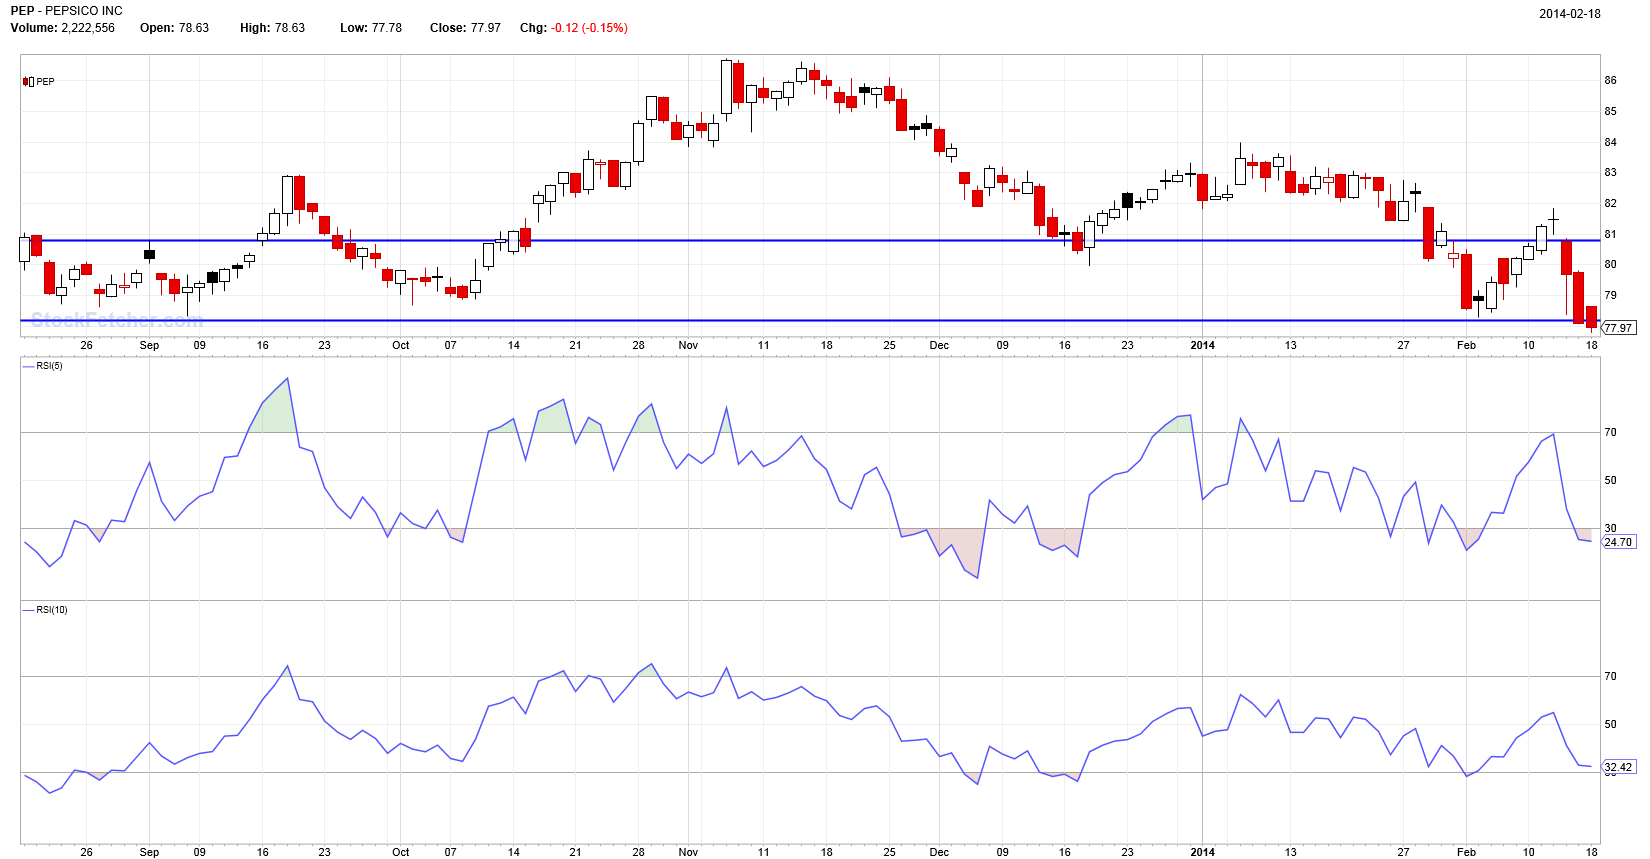 |
| Nickster8074 53 posts msg #118234 - Remove message |
2/18/2014 4:30:28 PM Looks as though you have a bullish divergence sir. |
| four 5,087 posts msg #118235 - Remove message modified |
2/18/2014 6:27:25 PM thanks. It worked in December. PS Yahoo says : After Hours : 78.37 Up 0.19 (0.24%) 5:47PM EST -- 2/18/14  |
| johnpaulca 12,036 posts msg #118248 - Remove message |
2/19/2014 11:55:33 AM Long at $77.51...stop at $77.40 |
| johnpaulca 12,036 posts msg #118268 - Remove message |
2/19/2014 10:39:49 PM next stop $76.25 |
| alf44 2,025 posts msg #118269 - Remove message modified |
2/19/2014 10:51:55 PM . ... uhhhhh ... what happened to the "initial STOP" ... @ 77.40 ??? Did I miss something ??? . |
| johnpaulca 12,036 posts msg #118272 - Remove message |
2/20/2014 12:22:37 AM $76.25 is next support if anyone else is trading it....I was stopped out |
| alf44 2,025 posts msg #118273 - Remove message |
2/20/2014 12:27:40 AM . ...ahhhhh ... I see !!! . |
| comsouls 10 posts msg #118274 - Remove message |
2/20/2014 12:39:36 AM please where is the bullish signal to go long? |
| four 5,087 posts msg #118275 - Remove message modified |
2/20/2014 12:55:55 AM comsouls, See chart posted above... 1. rsi is rising and price is making lows (see diagonal lines on chart) = bullish divergence More info: http://www.investopedia.com/articles/trading/04/012804.asp 2. the horizontal line shows several near touches from above PS still long |
| StockFetcher Forums · Stock Picks and Trading · PEP, of interest? | << 1 2 >>Post Follow-up |