| StockFetcher Forums · Stock Picks and Trading · CARG | << >>Post Follow-up |
| Mactheriverrat 3,178 posts msg #144637 - Ignore Mactheriverrat |
9/12/2018 5:21:17 AM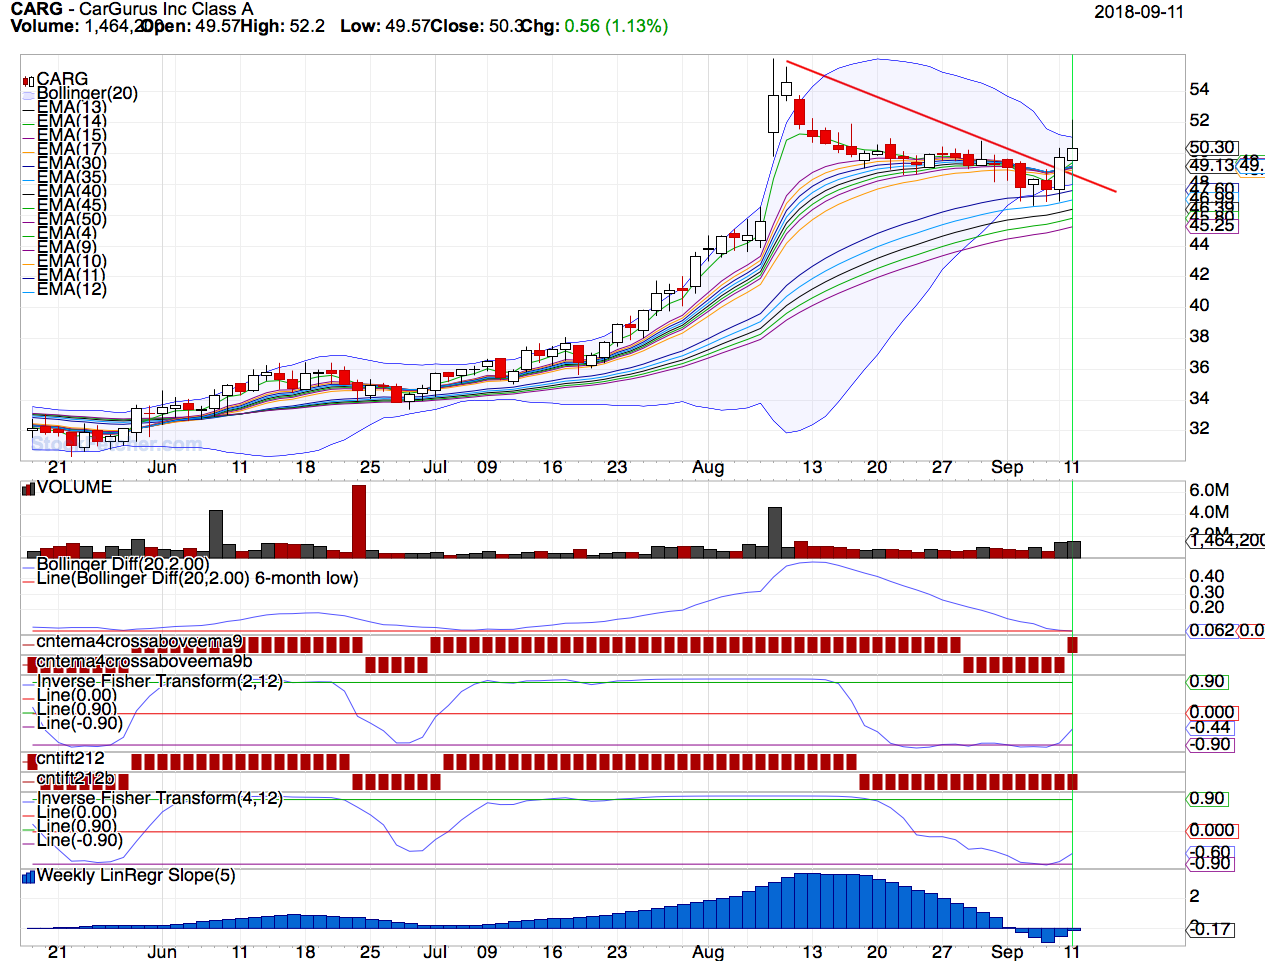 |
| Mactheriverrat 3,178 posts msg #144643 - Ignore Mactheriverrat |
9/12/2018 5:32:40 PM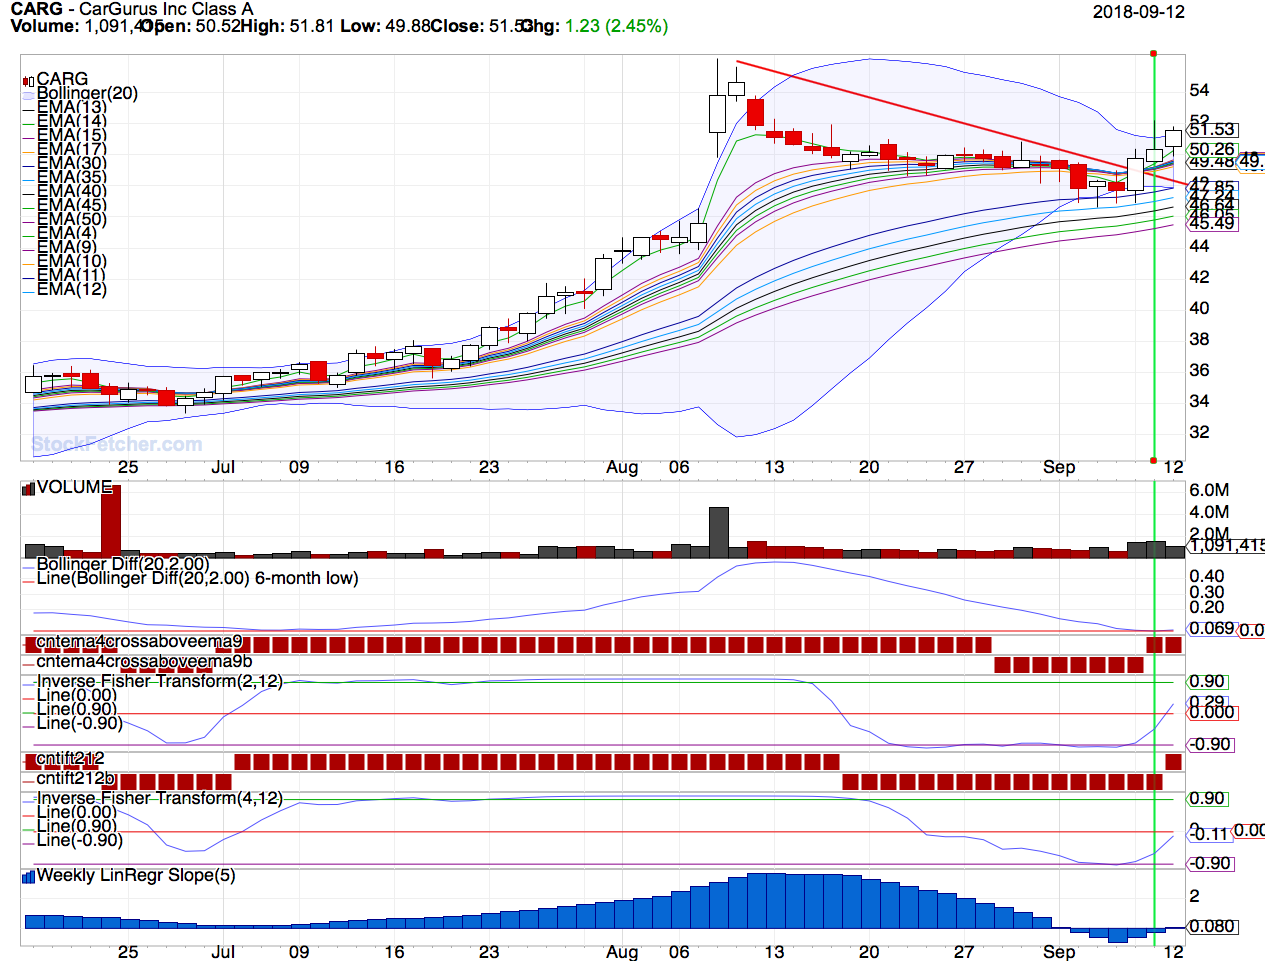 |
| Mactheriverrat 3,178 posts msg #144652 - Ignore Mactheriverrat |
9/13/2018 3:03:33 AM This is setting up for a nice multi day run. Like I said before stock price don't go up every day or down every day. If you can harness the trend one can have great gains. |
| Mactheriverrat 3,178 posts msg #144664 - Ignore Mactheriverrat |
9/13/2018 4:17:08 PM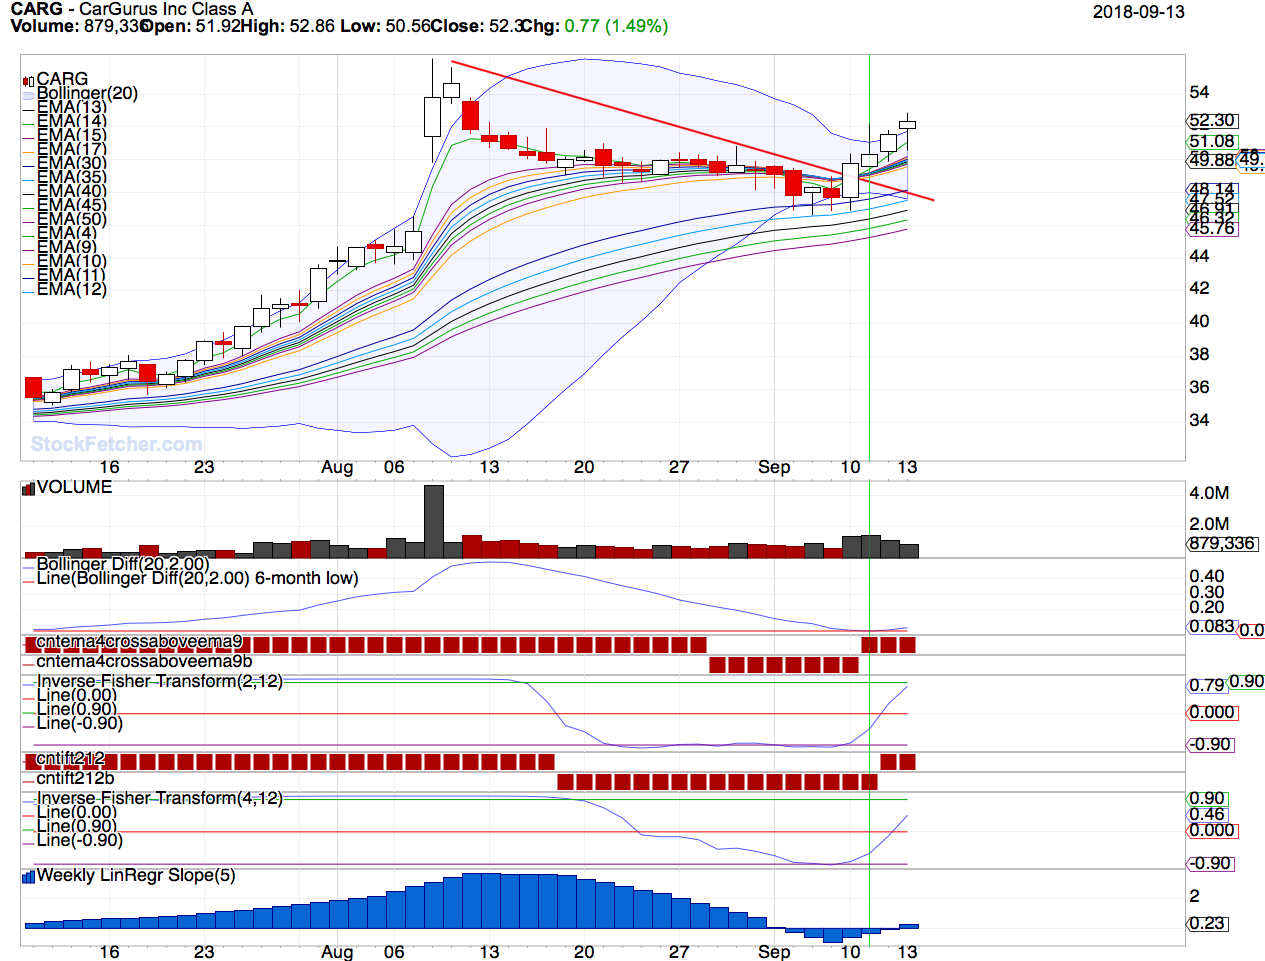 |
| Mactheriverrat 3,178 posts msg #144668 - Ignore Mactheriverrat |
9/15/2018 2:42:21 AM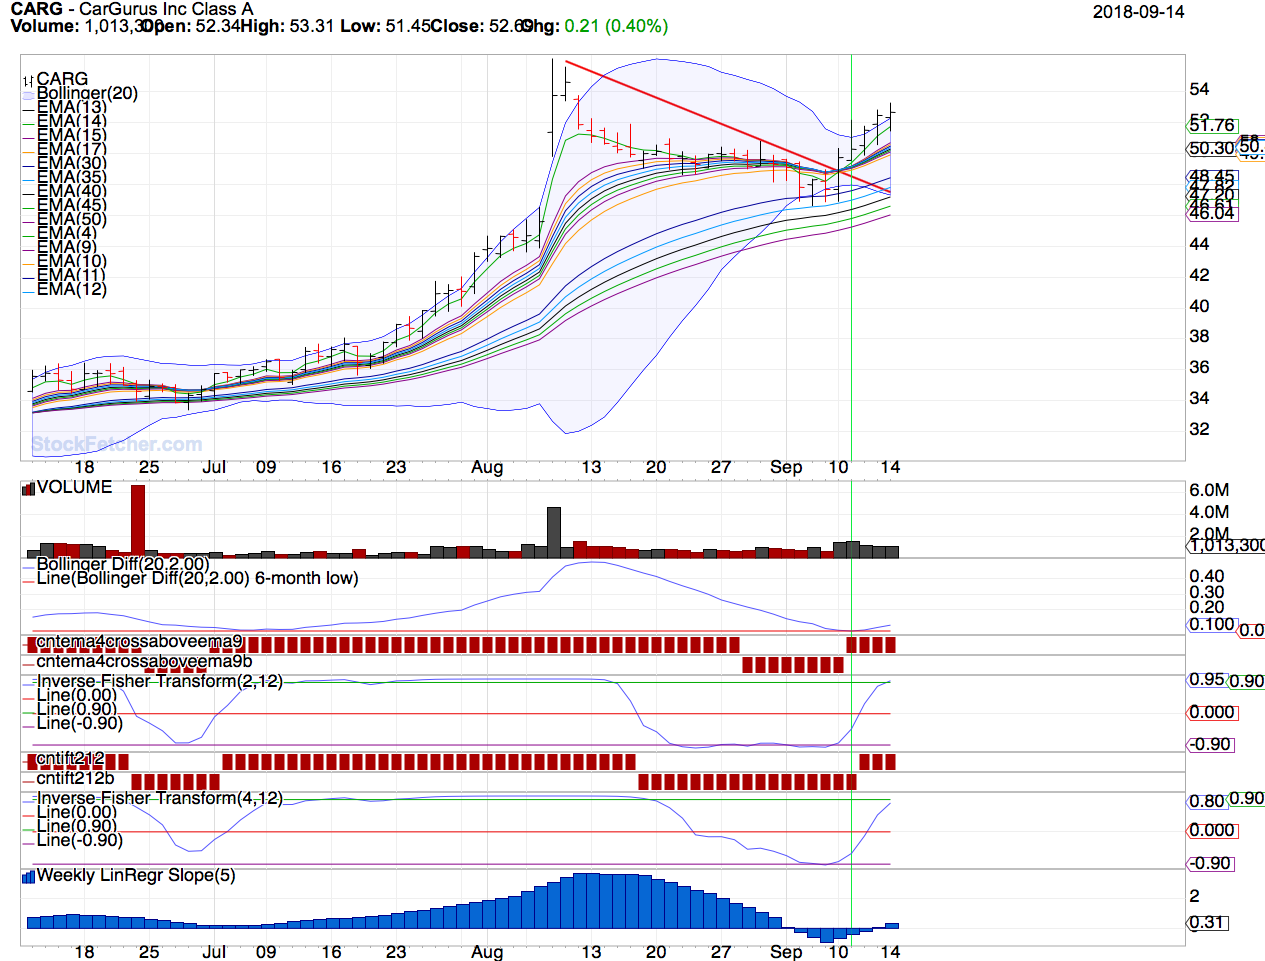 |
| nibor100 1,102 posts msg #144671 - Ignore nibor100 |
9/16/2018 10:59:41 AM Looks like price closed above the EMA(8) on the 10th at the same time RSI(4) crossed above 65, both also occurred on the same day Jul 2nd. Looks like those 2 indicators might be trade worthy signals when the Guppy's have the low avg group above the long term avg group; along with some group separation and general upward sloping. I definitely need to do some backtesting... Ed S. |
| Mactheriverrat 3,178 posts msg #144675 - Ignore Mactheriverrat modified |
9/16/2018 2:03:20 PM @ nibor100 Yes one could use draw rsi(4) line at 50.00 I myself look at a stock when the ema(4) cross above ema(9) also the Bollinger Bands at or near 6 month low. because from BB squeeze come expansion. The Guppys tell me the long investors are into CARG and the short term swing traders are coming back in. The IFT's and weekly linear regression(5) slope are just a add on's on Ive been playing with of late. |
| Mactheriverrat 3,178 posts msg #144689 - Ignore Mactheriverrat |
9/17/2018 11:32:02 PM Price down day but still uptrend. 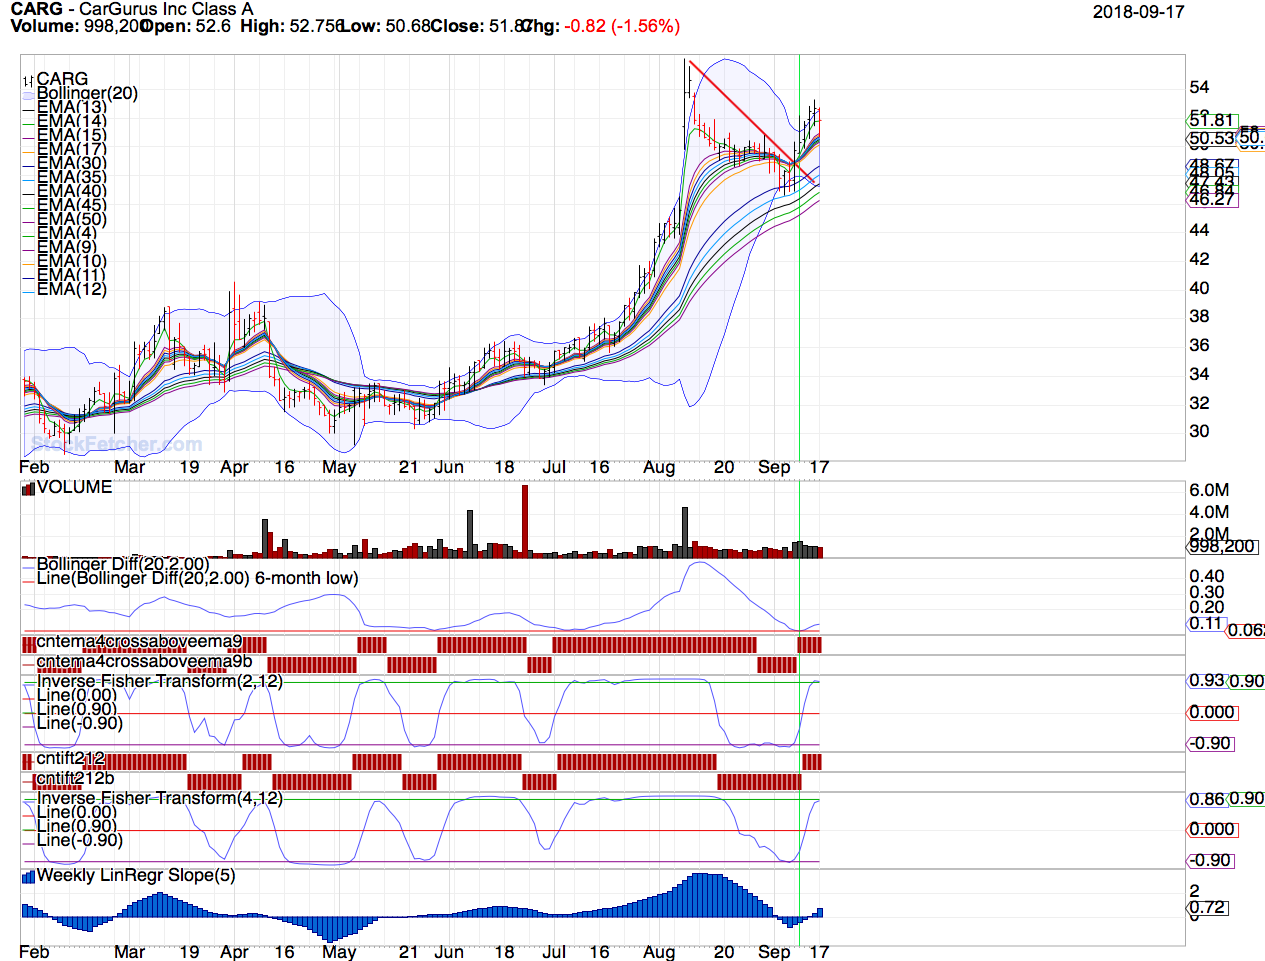 |
| StockFetcher Forums · Stock Picks and Trading · CARG | << >>Post Follow-up |