| StockFetcher Forums · General Discussion · John Carter - Squeeze | << 1 2 3 >>Post Follow-up |
| ron22 255 posts msg #152231 - Ignore ron22 modified |
5/17/2020 10:40:56 PM Sorry!. I hit post message twice |
| Mactheriverrat 3,178 posts msg #152232 - Ignore Mactheriverrat modified |
5/17/2020 11:39:13 PM That GOGO showed up on the filter I use from 13th_floors deadly combo. I've added a modified with some Guppy MMA's short term traders group from EMA 2 to EMA 17. Its starting to roll over to the upside. I'm showing a link of just the EMA's and no price to show the rollover.
|
| Mactheriverrat 3,178 posts msg #152250 - Ignore Mactheriverrat |
5/20/2020 11:35:43 AM I wish they all went this way. 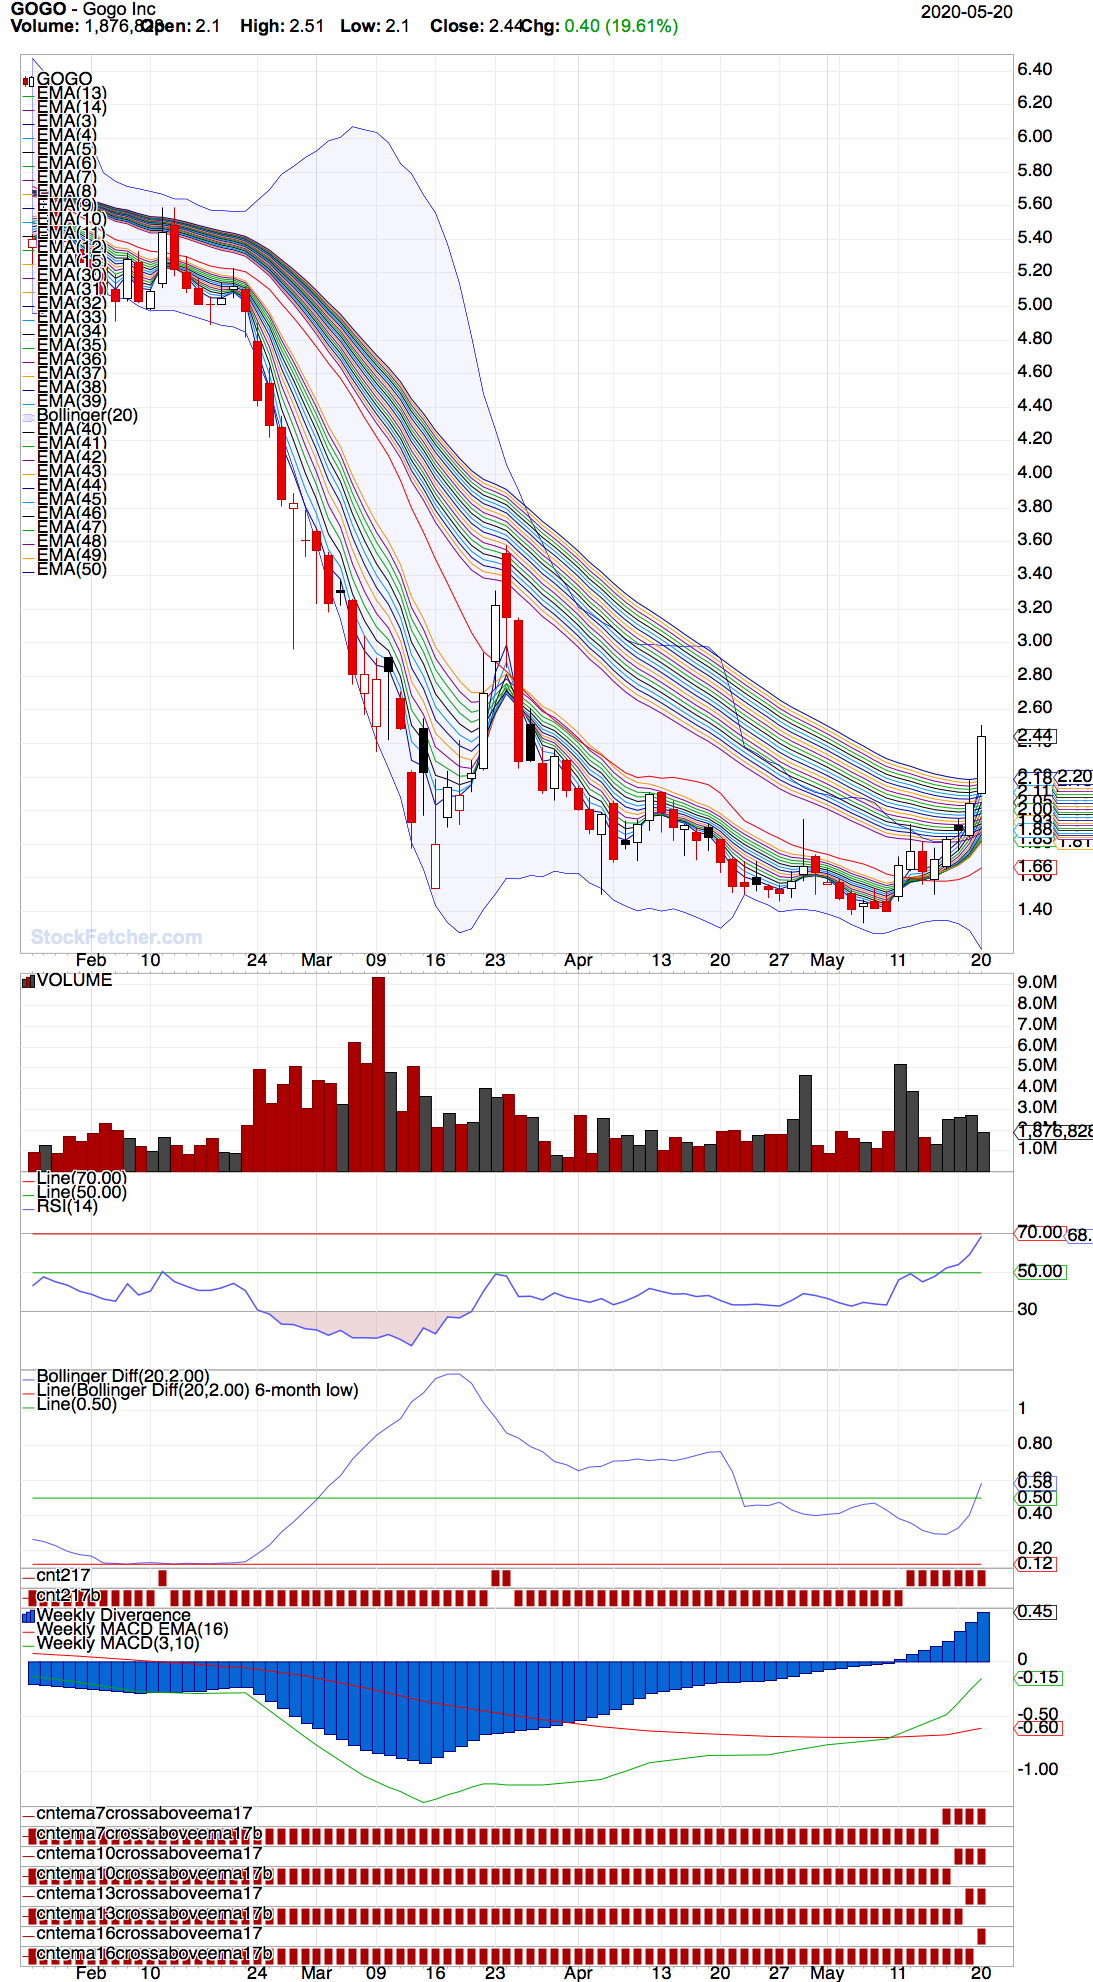 |
| svtsnakebitn 150 posts msg #152251 - Ignore svtsnakebitn |
5/20/2020 1:01:52 PM I'm linking the INTC setup right now - looks ready to pop! Anyone else's thoughts on it? |
| svtsnakebitn 150 posts msg #152253 - Ignore svtsnakebitn |
5/20/2020 3:52:21 PM Grabbed a couple INTC calls for 5/29 and 6/19 |
| Mactheriverrat 3,178 posts msg #152254 - Ignore Mactheriverrat |
5/20/2020 4:44:03 PM Yes INTC looks like a real good setup. |
| Mactheriverrat 3,178 posts msg #152259 - Ignore Mactheriverrat |
5/21/2020 2:55:15 AM BLUE looks like at a breakout setup. 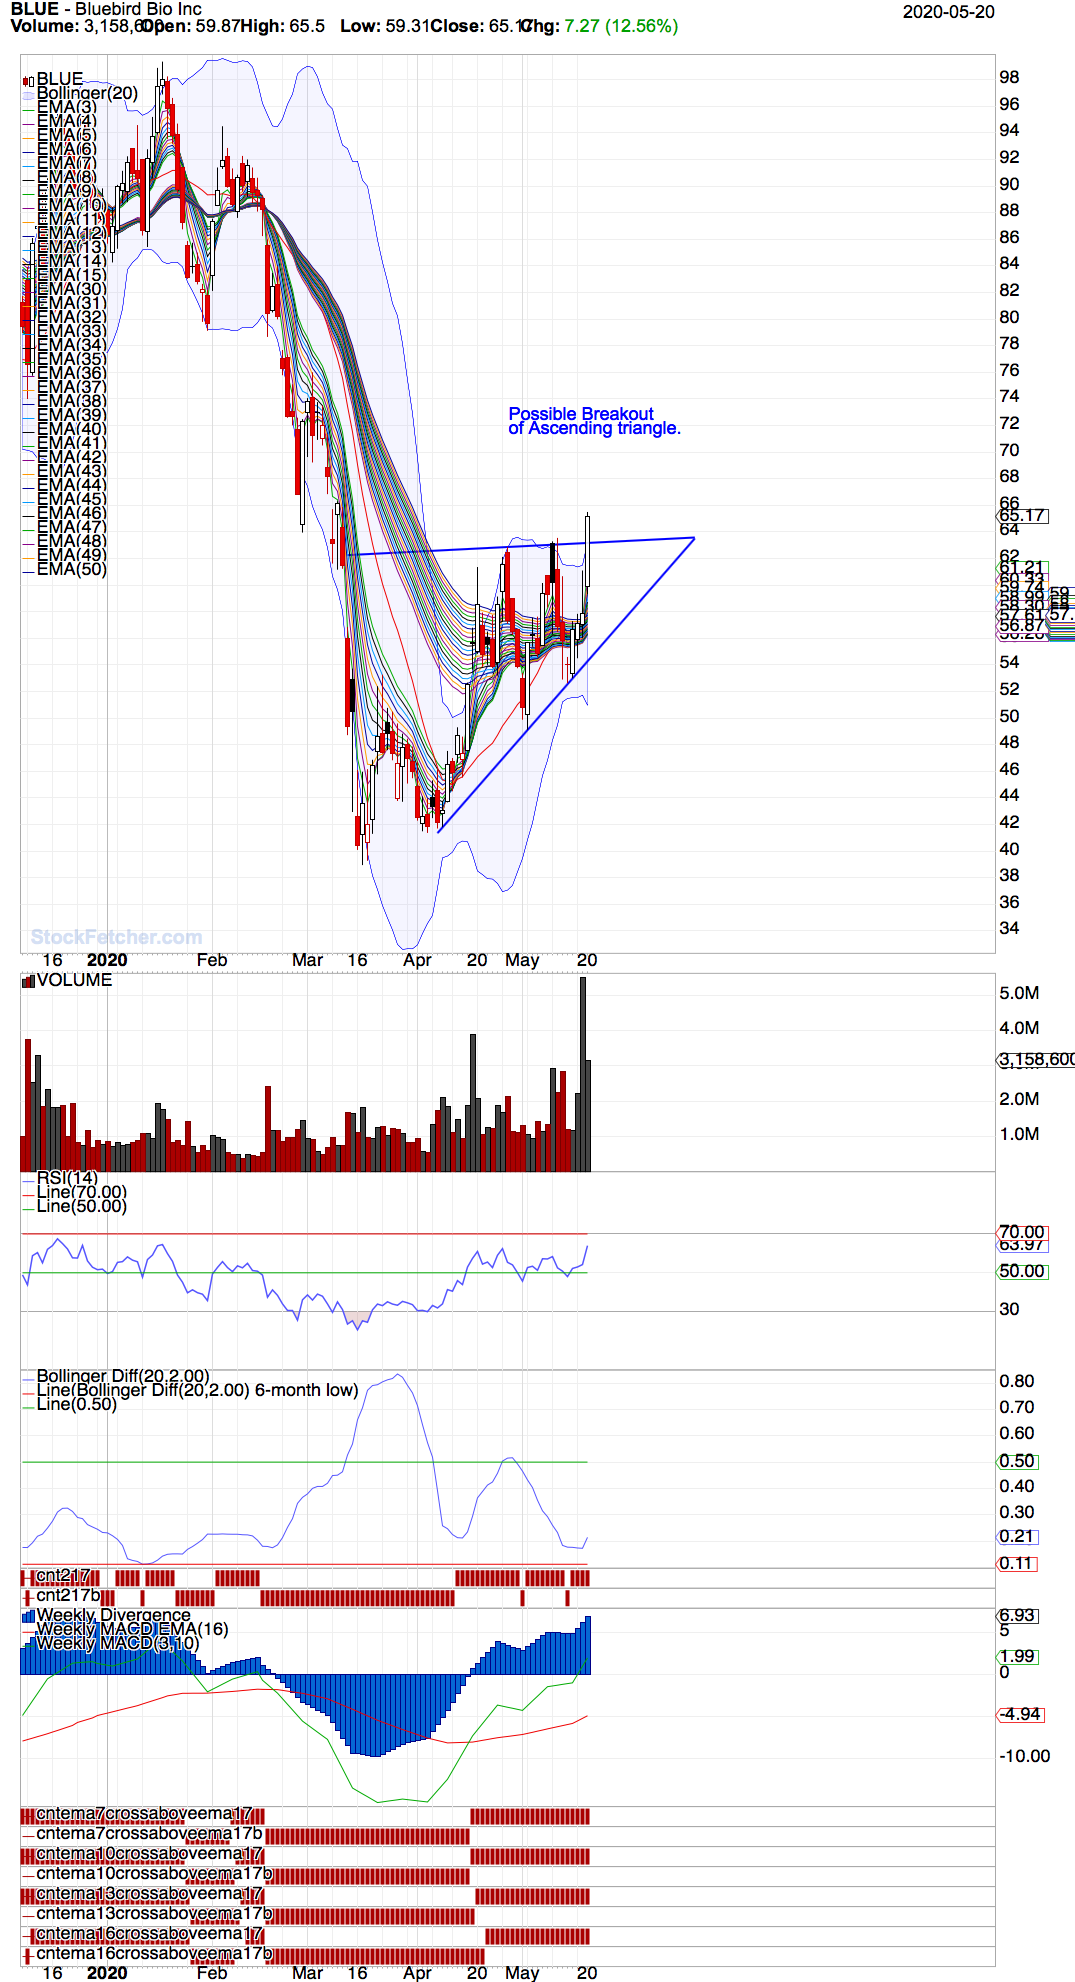 |
| Nobody 404 posts msg #152266 - Ignore Nobody |
5/21/2020 12:44:12 PM For my educational purpose - from todays list (5/21/2020) Is this a viable candidate just off charts to consider deeper look? Thank you 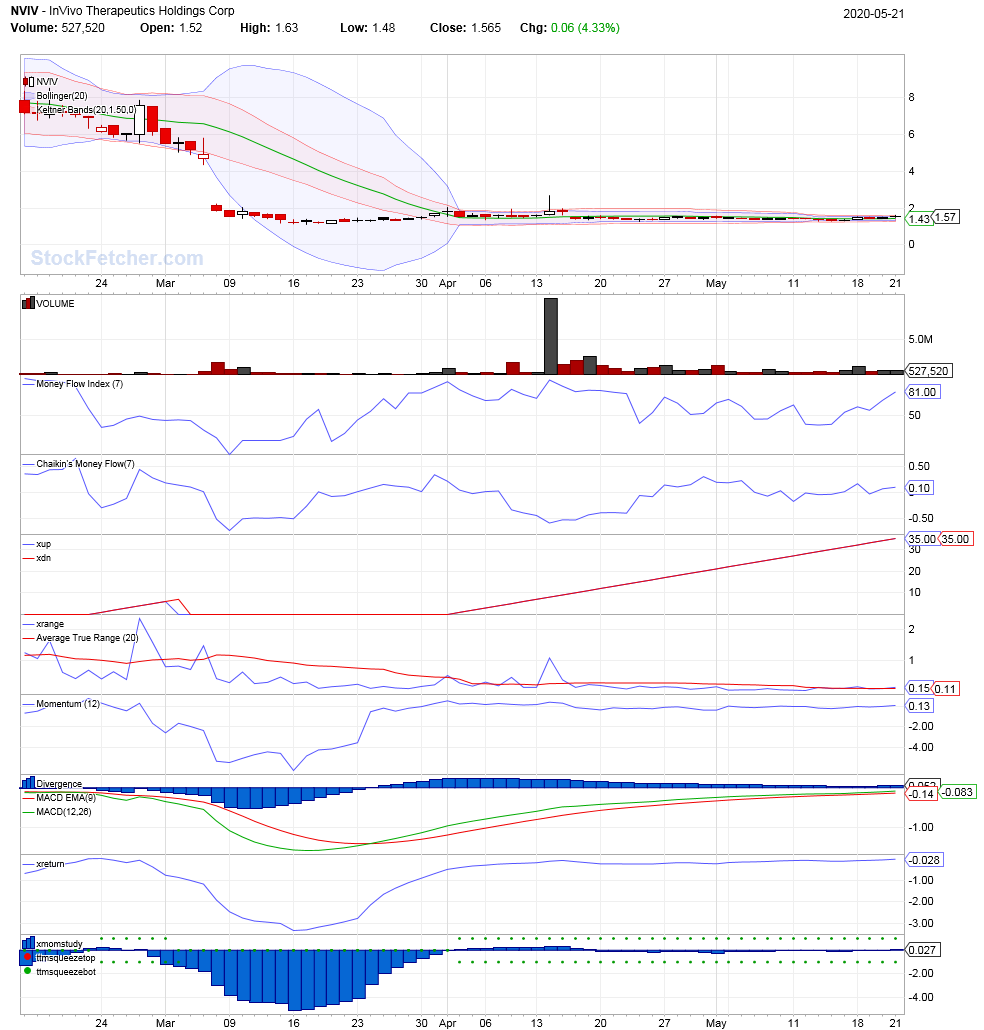 |
| xarlor 646 posts msg #152275 - Ignore xarlor |
5/21/2020 8:09:55 PM @Nobody, when a stock consolidates to a specific level immediately, then sits at that level for weeks, it usully signals an acquisition. Pass on these and look for the next trade. https://www.genengnews.com/news/pixarbio-offers-77m-to-acquire-invivo-therapeutics/81253637/ |
| nibor100 1,103 posts msg #152306 - Ignore nibor100 |
5/24/2020 9:34:44 AM @Mactheriverrat, On your chart of GoGo you have a plot display of Weekly MACD with histogram showing the last 8 vertical bars above the zero line and I believe every other plot displayed is showing daily data. I'm curious as to how you(we) are supposed to read/interpret those bars. Is each bar a weekly value based on the day the bar shows up on as the end of that particular week or is each bar a weekly value meaning those 8 bars represent 8 weeks of MACD action vs. all of the other plots showing 8 days of action in the similar plot area or do those bars represent something else? Thanks, Ed S. . |
| StockFetcher Forums · General Discussion · John Carter - Squeeze | << 1 2 3 >>Post Follow-up |