| StockFetcher Forums · General Discussion · Any swing traders here?? | << 1 ... 20 21 22 23 24 ... 25 >>Post Follow-up |
| Mactheriverrat 3,178 posts msg #112875 - Ignore Mactheriverrat modified |
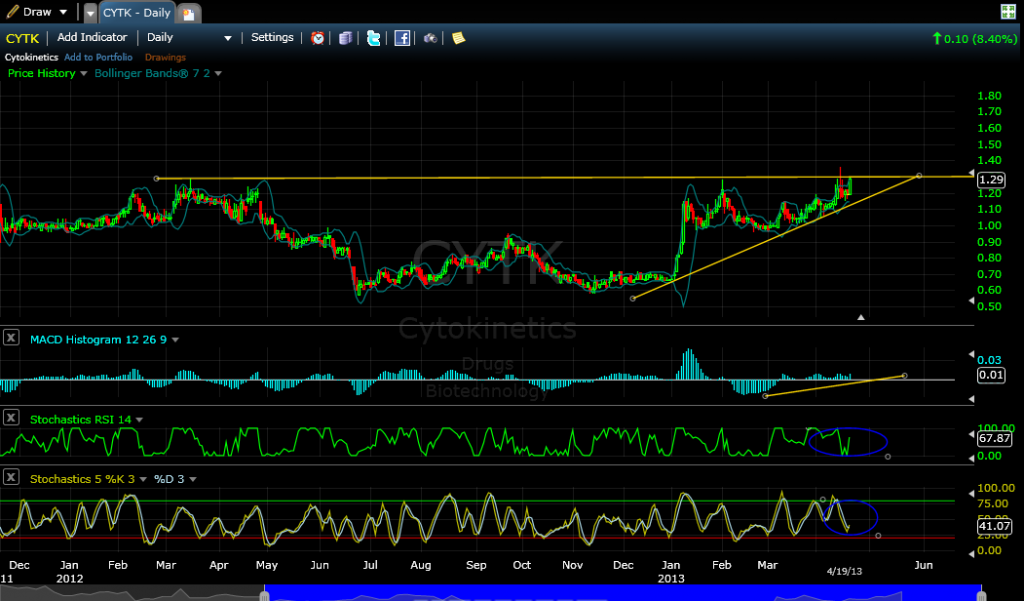
4/20/2013 4:07:43 PM Run a line resistance line ( on a 1 and a 1/2 year chart ) from say the high in jan of 2012 to the high across to the high the last few days. Then a support line running from the early jan 2013 up past the lows of recent trades. Remember the saying higher and higher lows. Ascending Triangle. Stochrsi(14) = above 0.80 tells that us when one wants to be in a stock / below 0.80 tells you when one wants to be out. Macd Hist = above 0 tells us bulls are in control, below tells us bears are in control. both bull and bear trends tell us who is getting strong or who already strong and getting stronger, Full Stoch (5,3,3)= k over d line cross = tells us when a short term trend change is in the process Macd Hist pg 127-135 and Stoch pg 157-161 from book "Trading for a living" by Dr. Alexander Elder. CYTK chart |
| Quilln 116 posts msg #112876 - Ignore Quilln |
4/20/2013 6:24:34 PM Mactheriverrat, re: CYTK I liked the way you created the bottom line "CYTK chart" and how does one produce the line like that without showing a very long string. very clever. Quilln - |
| Mactheriverrat 3,178 posts msg #112878 - Ignore Mactheriverrat modified |
4/20/2013 9:55:43 PM A thank you goes out to Four for this one. Just replace the URL and test . URL posting codes. |
| four 5,087 posts msg #112879 - Ignore four |
4/20/2013 11:35:07 PM Thanks... |
| Quilln 116 posts msg #112880 - Ignore Quilln |
4/21/2013 12:38:20 AM Kewl and thank you Four to make things a little easier |
| Mactheriverrat 3,178 posts msg #112889 - Ignore Mactheriverrat modified |
4/22/2013 12:19:41 AM I wanted to show 2 charts . One of CLDX and CYTK . I would say there will be a lot of shares trades one CYTX the next few days. Just saying 

|
| Eman93 4,750 posts msg #112908 - Ignore Eman93 |
4/23/2013 1:12:29 AM Nice call Mac! |
| Mactheriverrat 3,178 posts msg #112931 - Ignore Mactheriverrat |
4/24/2013 2:49:49 PM Just saying STP  |
| Quilln 116 posts msg #113071 - Ignore Quilln |
5/1/2013 11:38:00 AM another thought with CLDX and CYTK http://stockcharts.com/h-sc/ui?s=CLDX&p=D&yr=0&mn=4&dy=0&id=p57859394026 http://stockcharts.com/c-sc/sc?s=cldx&p=15&b=9&g=3&i=p03097103070&a=159176998&r=8510 Simon Sez gave a sell signal three days ago http://stockcharts.com/h-sc/ui?s=CYTK&p=D&yr=0&mn=4&dy=0&id=p80601703326 http://stockcharts.com/c-sc/sc?s=cytk&p=15&b=9&g=3&i=p03097103070&a=159176998&r=8510 Simon Sez gave a sell signal with a possible headfake ! http://stockcharts.com/h-sc/ui?s=STP&p=D&yr=0&mn=4&dy=0&id=p25677126739 keeping charts clean, simple and easy to read. basically, we are getting a 3 fer.....13/50ema, Simon Sez, and the RSI CCI combos. Followed by the use of Parabolic SAR's for directional flow. http://www.onlinetradingconcepts.com/TechnicalAnalysis/CommodityChannelIndex.html http://www.onlinetradingconcepts.com/TechnicalAnalysis/RelativeStrengthIndex.html Just a thought. Best regards, Quilln - |
| four 5,087 posts msg #113099 - Ignore four modified |
5/2/2013 10:23:41 PM symlist(spy,sh) draw ema(13) draw ema(50) Quilln , Still going strong... !  |
| StockFetcher Forums · General Discussion · Any swing traders here?? | << 1 ... 20 21 22 23 24 ... 25 >>Post Follow-up |