SAFeTRADE
661 posts
msg #160730
- Ignore SAFeTRADE |
12/21/2023 4:42:44 PM
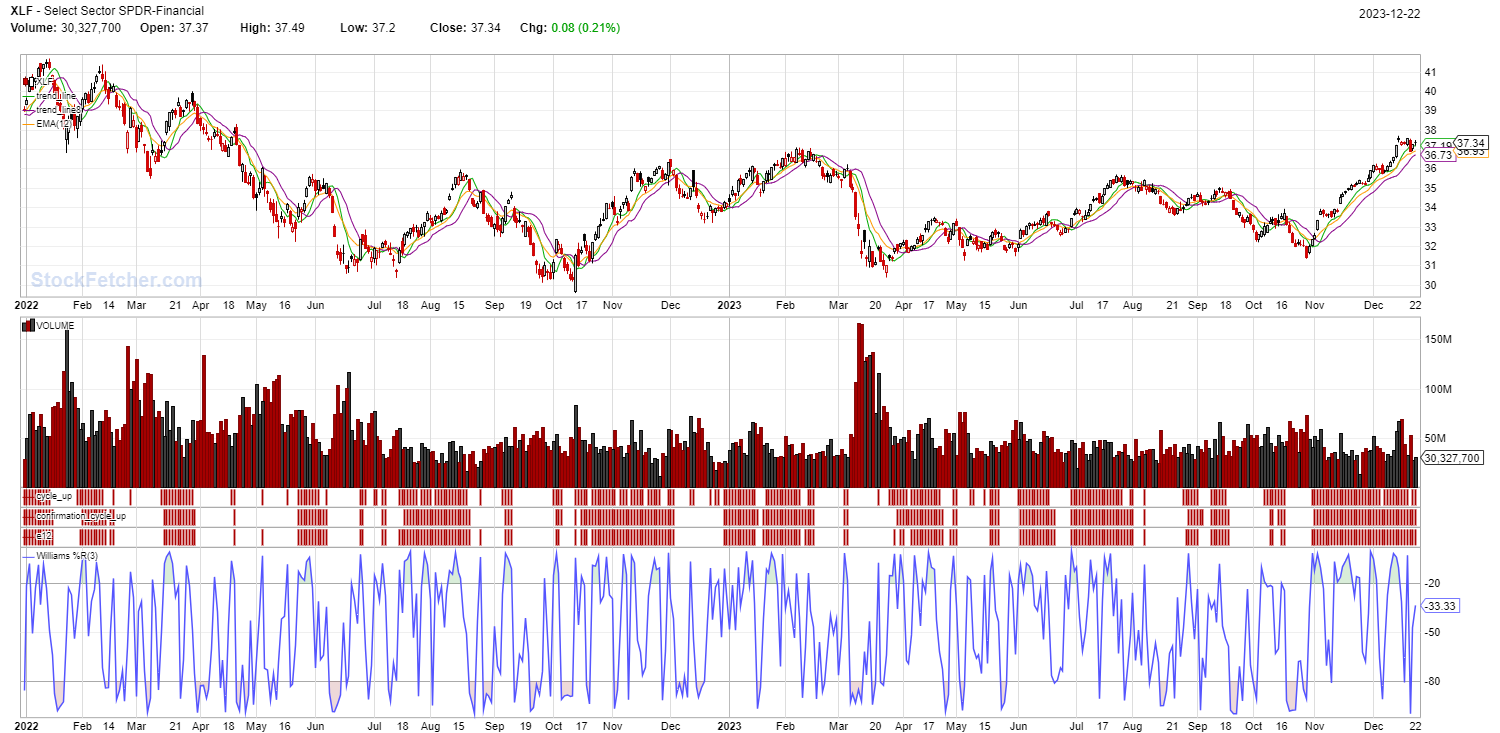
Using an inverse MACD to plot up and down cycles (not Harleys). As the trend line rises
to meet price prepare for a new cycle. You also see expansion and contraction.
Comment box open |__________|
|
snappyfrog
753 posts
msg #160732
- Ignore snappyfrog
modified |
12/23/2023 7:27:57 AM
I'm a simple trader. The more simple the better for me.
I plotted and counted the close above the EMA(12) and came up
with pretty much the same thing.
It is neat to see how some of you manipulate coding in SF,
but I get lost many times and strive to make it as simple as possible.
|
Mactheriverrat
3,178 posts
msg #160733
- Ignore Mactheriverrat |
12/23/2023 3:12:03 PM
Interesting Code!!!!
|
Mactheriverrat
3,178 posts
msg #160734
- Ignore Mactheriverrat
modified |
12/23/2023 3:13:49 PM
The code for ema 12 .
/* 1212 is number of consecutive days EMA(12) above (+)/below(-) previous EMA(12) */
set{1212b,days( ema(12) is above ema(12) one day ago ,250)}
set{1212a,days( ema(12) is below ema(12) one day ago,250)}
set{12, 1212a - 1212b} and add column 12 {12}
Set{cntema12aboveema12,count( eMA(12) > eMA(12) one day ago,1)}
draw cntema12aboveema12
Set{cntema12aboveema12b,count( eMA(12)< EMA(12) one day ago,1)}
draw cntema12aboveema12b
|