| StockFetcher Forums · Filter Exchange · PORTFOLIO SELECTION AND MANAGEMENT USING RISK/REWARD RATIOS | << 1 ... 60 61 62 63 64 ... 65 >>Post Follow-up |
| Toad 20 posts msg #124503 - Ignore Toad modified |
7/23/2015 11:59:13 PM Just a quick follow up. After changing my sheet for adjusted closing data, I believe my analysis is more closely matching Kevin's. So Mahkoh and Kevin please accept some virtual cookies as gratitude for helping me find my error and giving me the means to check my analysis. One question I have about the StrataSearch though is: Is the equity curve that is being generated an averaged equity curve for all the runs in the Monte Carlo analysis? I imagine it is...not sure what it would be otherwise. I ask because the overall gain is close to what I am getting for the average of all possibilities with my analysis....in which case I think we are in agreement. I will develop somewhat "bastardized" equity curves (only updating on the month not day) and post them tomorrow or Saturday to illustrate my concerns with the technique. It does look a little better than my initial impression of it though. Edit: Kevin -- Is it possible to export the equity curve as a .csv or some other text format so I can import it into excel. This would be the easiest way to compare I think. I will send you a virtual cake if you can do that :P. |
| mahkoh 1,065 posts msg #124506 - Ignore mahkoh |
7/24/2015 5:52:22 AM Market turmoil equals large drawdowns, I guess we all can agree to that. Still, looking at Toad's file (good job there, btw) it seems rather peculiar that there is such a large deviation in returns upon choice of reallocation date. |
| Toad 20 posts msg #124524 - Ignore Toad modified |
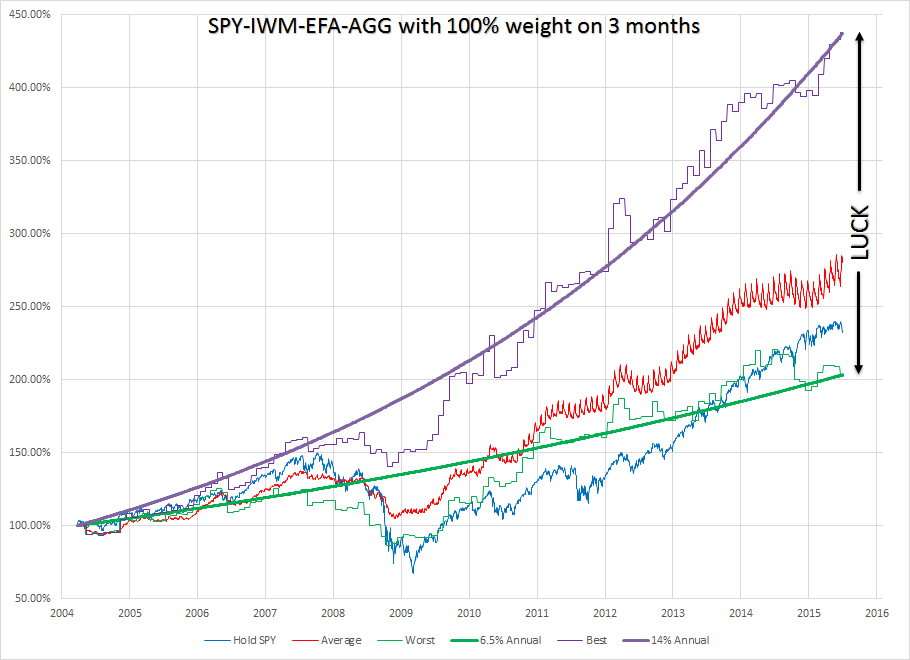
7/24/2015 9:44:43 PM I have updated the spreadsheet for the adjusted close values. The optimization study ended up on the same results (ideal for SPY-IWM-EFA-AGG is 3 month look back, ideal for SPY-AGG is 70% 6 month, 30% 3 month). The updated spreadsheet can be obtained here: http://www.mediafire.com/view/gr3j8hyd14vg3mk/Kevin%27s_Mutual_Funds_Screener_Validation_-_Updated.xlsx The revised results are as follows for the SPY-IWM-EFA-AGG: - The optimal look back to use is the 3 month and nothing else - The average account balance of the 21 possible reallocation days was 272% - The standard deviation was 63% - The max balance was 438% - The min balance was 203% - The lowest period (21 day) return was -33% - The highest period (21 day) return was 17% A graph illustrating my concern with the method is below: 
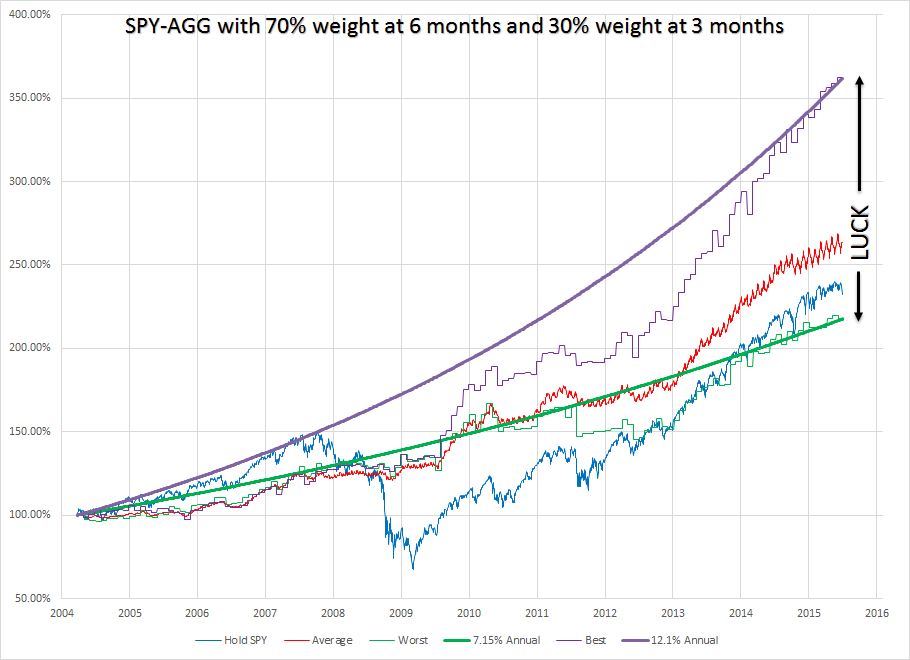
From this graph you can see that the annual return varies between 6.5% and 14% depending on the day you select to reallocate funds. At worst you end up basically following SPYÖsimilar drawdowns, similar gains. Over a period of 11 years, the luck can make a substantial difference to your account. Comparing my graph to Kevinís, you can see that my ďaverageĒ curve is the same as his equity curve. Mine has some fuzz in it since I was only picking up the on the month values, not the individual day values and I didnít try to smooth the curve out any after averaging. The revised results are as follows for the SPY-AGG: - The optimal look back to use is 70% 6 months, 30% 3 months - The average account balance of the 21 possible reallocation days was 263% - The standard deviation was 39% - The max balance was 363% - The min balance was 217% - The lowest period (21 day) return was -16% - The highest period (21 day) return was 14% A graph of this one showing the same problem, but to a lesser degree, is below: 
From this graph you can see the annual return varies from 7.15% to 12.1% depending on the day you select to reallocate funds. Again, at worst you end up similar to SPY. The difference is, that this one seems to always avoid the large drawdowns. To me it is not surprising that this one has less variance since it only uses 2 funds instead of 4. Comparing my graph to Kevinís you can see that my average curve is slightly lower than his equity curve. I believe this is because we were optimizing for different conditions. I sought to maximize the minimum (the green jagged line) with the thought that this would give me the highest possible returns with the lowest standard deviation (amount of luck). This resulted in the 70% 6 month, 30% 3 month. Kevin sought to maximize the average which results in 100% 6 months. Which system is better? The SPY-IWM-EFA-AGG or the SPY-AGG? I donít know. Since this is a long term strategy, it seems either way you go the worst you will do is follow SPY. The SPY-IWM-EFA-AGG system has more upside potential but you have to be able to stomach the larger drawdowns. Is there statistical significance to reallocating funds this way? Maybe, but there isnít as much as I expected. Iím still on the fence about using this myself although I certainly havenít come up with anything better. Also, as a comparison using the adjusted close values: - Hold SPY 3-26-04 to 6-1-15 --> 238% balance (shown on graphs) - Hold IWM 3-26-04 to 6-1-15 --> 252% balance - Hold EFA 3-26-04 to 6-1-15 --> 194% balance - Hold AGG 3-26-04 to 6-1-15 --> 158% balance Feel free to go into my spreadsheet and dissect itÖtry to find an error somewhere. At this point I would be very surprised if there is, but I still hope there is. I will not be revisiting it myself in search of errors anymore, but if someone sees something, let me know and I will look into it. |
| mahkoh 1,065 posts msg #124530 - Ignore mahkoh |
7/25/2015 5:16:08 PM Just a thought: Maybe window dressing by hedge funds every quarter has an influence? |
| amtmail 34 posts msg #124535 - Ignore amtmail modified |
7/26/2015 3:05:45 AM Kevin , Thank you for your information but can you provide us with the SS code for this strategy. Also if i like to use the ranking 60 % on 3 Months returns and 40 % on 21 days volatility how i can code it in SS code? |
| sohailmithani 192 posts msg #124541 - Ignore sohailmithani |
7/27/2015 4:35:29 PM Toad, Am unable to open up your excel sheet from the link provided. Please check and confirm. Wondering if for timing of entry we add RSI(2) to be at certain over sold level before we get into the symbol for the month and sell it at certain RSI(2) level. Would that improve the results in any way? Thanks |
| Toad 20 posts msg #124542 - Ignore Toad modified |
7/27/2015 6:03:33 PM I checked the link and it is good. I was able to download and open it just fine. It is a large file so you will not be able to open it in your browser, you will need to download it and open it. Also, you will need Excel 2007 or later. If you still can't get it to open after checking those things then I am not sure why. As far as adding in RSI(2) to time the entry, I do not think that will do much good. When Kevin and I (and other people earlier) optimized it, we all came up with the later period look backs as being the most effective for this. The RSI(2) is a very short term indicator so I am not sure it will do much good for a buy and hold for a month type strategy like this one. I really know very little about this stuff now though as I am very new to trading, so maybe I am off base with saying that. |
| Kevin_in_GA 4,599 posts msg #124543 - Ignore Kevin_in_GA |
7/27/2015 7:30:04 PM Guys: Please stop trying to "optimize" this. You're trying to turn this into a trading system (which it isn't). This is designed for 401k accounts where you are often limited to asset class funds rather than stocks, and not allowed to trade too frequently. This system is where I want it to be. One variable is all that it is based on, and yet somehow people want to keep adding entry/exit criteria in the hopes of squeezing out more profit. It is based on monthly bars, not mid-month trading dates. It is based on simple performance over time, not any RSI value. The truth is that you are most likely overfitting the system and making it LESS likely to work as well in the future. I won't write any more code on this because no more code is needed. Kevin |
| sohailmithani 192 posts msg #124544 - Ignore sohailmithani modified |
7/27/2015 7:39:14 PM Got it Sir. Will trade it as prescribed. Could you please give us the final code you use to trade it as it has become more confusing now. Is the following I should be looking at each month end for next month symbol? symlist(spy,iwm,efa,agg) sort on column 5 descending set{start,date(20140930,close)} set{ch,close - start} set{sort,ch / start} set{sort%,sort * 100} add column sort% If so then I get following values for 2015: Jan - IWM Feb - AGG Mar - IWM Apr - EFA May - EFA June - EFA July - IWM Are these correct? Thanks everyone for helping me here. |
| Toad 20 posts msg #124545 - Ignore Toad modified |
7/28/2015 12:17:53 AM Correct me if I'm wrong, but I believe you need to manually change the look back each month. So this month the code will be: Otherwise you will be using a different look back period. Also, code shouldn't be run until end of day Friday since that will be the selection day. Also be aware that you want to select the fund set which has the highest sort% (least negative or hopefully most positive). |
| StockFetcher Forums · Filter Exchange · PORTFOLIO SELECTION AND MANAGEMENT USING RISK/REWARD RATIOS | << 1 ... 60 61 62 63 64 ... 65 >>Post Follow-up |