| StockFetcher Forums · Filter Exchange · MONDAY GAP UP AND GAP DOWN TRADING SYSTEMS | << 1 2 3 4 5 ... 14 >>Post Follow-up |
| Kevin_in_GA 4,599 posts msg #104555 - Ignore Kevin_in_GA modified |
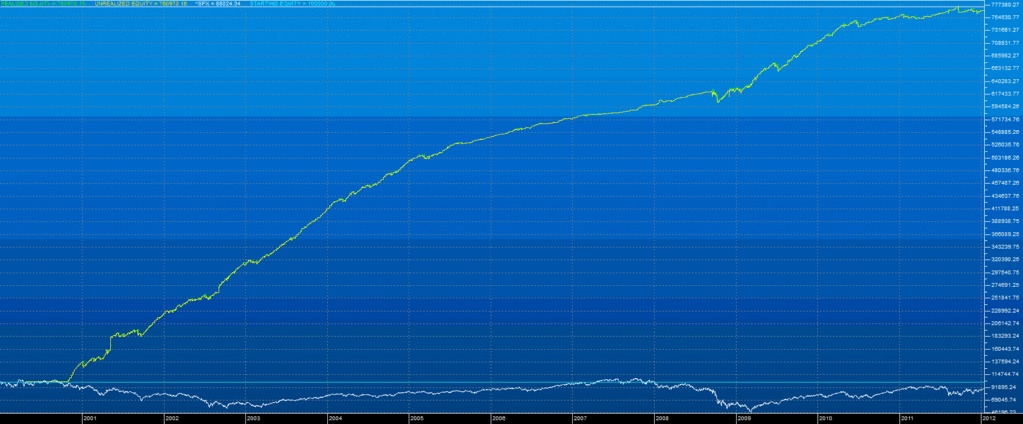
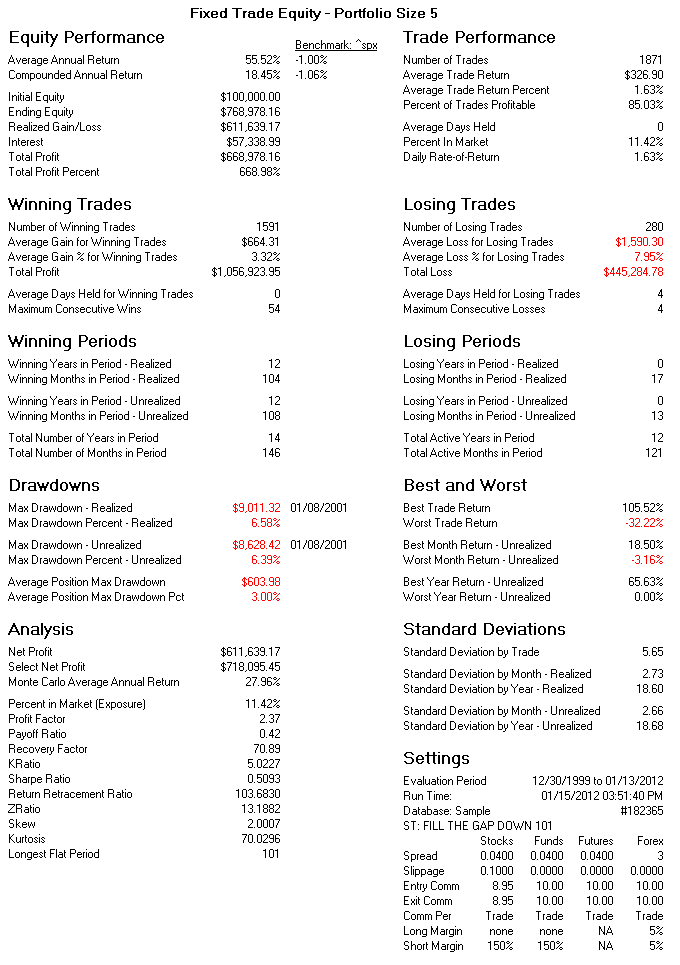
1/20/2012 3:44:29 PM This thread is really a continuation of my original Monday morning gap down thread located here. I put some time into refining the code, wanting it to be easily implemented here using SF. The basic idea is simlar to many "Fade the Gap" filters developed here, but distinct in that significant time was spent backtesting and optimizing the code (my goal was to keep it simple yet profitable, with the resulting code being as parsimonious as possible). I looked at a wide range of time ranges, gap sizes, frequencies, and percent fills in both directions for the Russell 2000 stocks from mid-2000 through to last Friday. The best combination over the past 11 years is captured here - just run this filter over the weekend, and track all of the stocks with the percent of gaps filled at 70% or higher. Here is the LONG trade system - if the stock gaps down more than 2% from the previous Friday close, buy. Set a profit stop at the previous Friday close. If this is not hit by Friday, close the trade at the end of the week. You are ALWAYS 100% in cash over the weekend. 

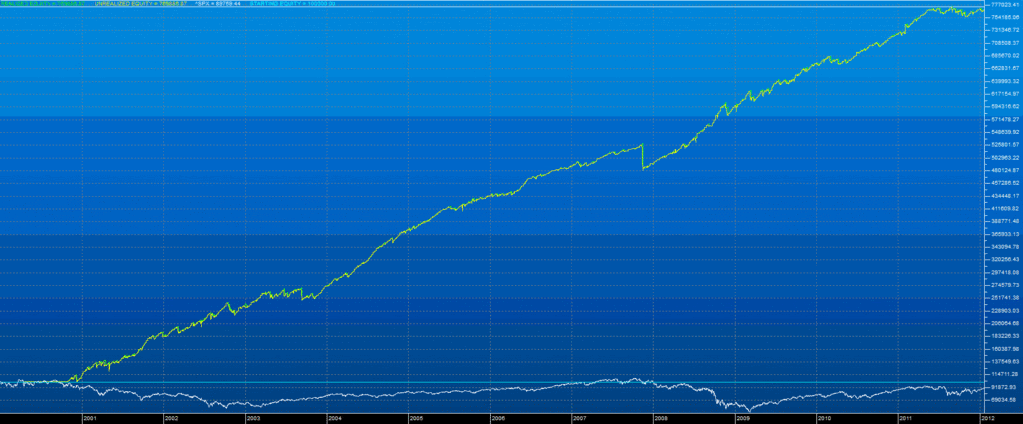
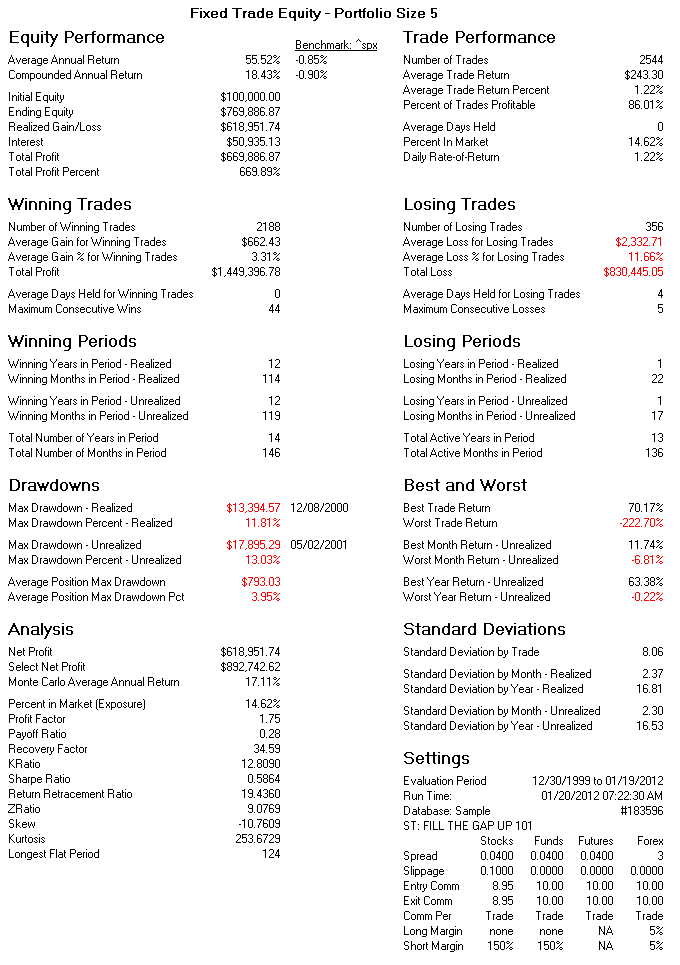
The short trade version looks for Monday gaps up of greater than 2% above the previous Friday's close, and closes the trade when the low crosses below the previous Friday close. Here is the SHORT trade system - if the stock gaps up more than 2% from the previous Friday close, go short. Set a profit stop at the previous Friday close. If this is not hit by Friday, close the trade at the end of the week. Just like the previous filter, you are ALWAYS 100% in cash over the weekend. 

In both filters, you only consider stocks where PCT_GAPFILL is 0.70 or higher. Be aware that this will generate a large number of candidates that need to be tracked, but no more than 5 positions are ever opened in any week. The selection in cases where more than 5 are generated are by PCT_GAPFILL descending (which is why I sorted on column 7 descending in both filters). A key thing about this approach - no indicators are used. The trades are selected based solely on statistical performance over the past 80 weeks. Note also that the win percentages are quite high at 80-85%, and the Sharpe ratios are insanely good through an 11 year period with two major recessions. These charts and stats are based on a few things: 1. Trade amounts are ALWAYS FIXED at $20,000 and a portfolio size of 5. This is not a variable trade strategy, which means even if you have $1,000,000 you still would only risk $100,000 max in any week. 2. Slippage is 0.1% on both sides of the trade 3. Commissions are $8.95 per side. 4. All trades include $0.04 bid/ask spread on both ends - not actually relevant if you are using limit orders, but I put it in here to account for market entries if needed. 5. No stop losses are used. 5. All open trades are closed on Friday. No positions held over the weekend. I'll be tracking these systems on my web site www.statisticalinvesting.com. Candidates will be posted each weekend for the following Monday. Monday evening will have a list of the trades entered (and possibly closed by end of day). Enjoy. Kevin |
| jackmack 334 posts msg #104556 - Ignore jackmack |
1/20/2012 4:14:59 PM Awesome as always Kevin - thank you |
| levamit 101 posts msg #104559 - Ignore levamit modified |
1/20/2012 4:53:16 PM Hi Kevin, Check my filter and the strategy is Less complicated , Basic Setup Name: last 3% 09-10 Approach Type: Long Start Date: 12/31/2008 End Date: 12/31/2010 Benchmark Symbol: ^SPX Exit Setup Stop Loss: 40% Profit Stop: 3% Trailing Stop Loss: N/A Minimum Holding Days: 1 Maximum holding days: 5 Extra Indicators Entry Columns: Show Performance After: after 1 day after 2 days after 3 days after 4 days Advanced Options Selection Method: select by volume descending Entry Price: close Conditional Entry: Yes Exit Price: open Maximum Trades Per Day: 25 Maximum Open Positions: 250 Maximum Selected Stocks: All Close all OPEN positions: No Trade Statistics There were 686 total stocks entered. Of those, 686 or 100.00% were complete and or 0.00% were open. Of the 686 completed trades, 587 trades or 85.57%resulted in a net gain. Your average net change for completed trades was: 2.00%. The average draw down of your approach was: -9.03%. The average max profit of your approach was: 9.93% The Reward/Risk ratio for this approach is: 2.12 Annualized Return on Investment (ROI): 251.55%, the ROI of ^SPX was: 20.20%. Exit Statistics Stop Loss was triggered 3 times or 0.44% of the time. Stop Profit was triggered 576 times or 83.97% of the time. Trailing Stop Loss was triggered 0 times or 0.00% of the time. You held for the maximum period of time (5 days) 107 times or 15.60% of the time. An exit trigger was executed 0 times or 0.00% of the time. Standing on total net gain of 1372.81% you can remove the stop loss also, What are you thinking about the filter ? Regards, L.A |
| Kevin_in_GA 4,599 posts msg #104562 - Ignore Kevin_in_GA |
1/20/2012 9:24:46 PM This probably should have its own thread, since what I am trying to do here is different, but OK. Let's look at it. My backtest of this filter over the last four months (9/20/2011 until 1/20/2012) using the settings you list shows the following: There were 128 total stocks entered. Of those, 127 or 99.22% were complete and 1 or 0.78% were open. Of the 127 completed trades, 106 trades or 83.46% resulted in a net gain. Your average net change for completed trades was: 1.21%. The average draw down of your approach was: -9.59%. The average max profit of your approach was: 8.82% The Reward/Risk ratio for this approach is: 1.66 Annualized Return on Investment (ROI): 145.97%, the ROI of ^SPX was: 27.07%. Exit Statistics Stop Loss was triggered 1 times or 0.79% of the time. Stop Profit was triggered 104 times or 81.89% of the time. Trailing Stop Loss was triggered 0 times or 0.00% of the time. You held for the maximum period of time (5 days) 22 times or 17.32% of the time. Your Equity Summary indicates a net gain of only $616.33 Because you were willing to hold 250 open positions, the maximum bet on any stock was $400. So the return per trade was worth, on average $4.84. Remember that SF's backtests do not include any commissions. If I reduce the number of open positions to 10 max, we get the following: There were 82 total stocks entered. Of those, 81 or 98.78% were complete and 1 or 1.22% were open. Of the 81 completed trades, 61 trades or 75.31% resulted in a net gain. Your average net change for completed trades was: 0.00%. The average draw down of your approach was: -9.86%. The average max profit of your approach was: 8.23% The Reward/Risk ratio for this approach is: 1.00 Annualized Return on Investment (ROI): 0.02%, the ROI of ^SPX was: 27.07%. Exit Statistics Stop Loss was triggered 1 times or 1.23% of the time. Stop Profit was triggered 59 times or 72.84% of the time. Trailing Stop Loss was triggered 0 times or 0.00% of the time. You held for the maximum period of time (5 days) 21 times or 25.93% of the time. An exit trigger was executed 0 times or 0.00% of the time. In this case your equity gain was -$260.66 (again, before commissions). Please check these numbers and confirm. Kevin |
| mmaurice 51 posts msg #104565 - Ignore mmaurice |
1/20/2012 11:27:01 PM Kevin, Looks like a nice little filter. Specifically on the Long Filter, I have a couple questions about your Stratasearch results. 1. There are 14 years in the period but there are only 12 winning years displayed. Where are the other 2 years? 2. Same for the months, things aren't adding up. 3. The best return is 105.52%. Seems like there might be some funny business in the results. Did you validate the extreme cases. Could this be a stock split? 4. The worst year return was 0%, which year? 5. There is "interest" included in the profit numbers, where did that come from? |
| Kevin_in_GA 4,599 posts msg #104566 - Ignore Kevin_in_GA |
1/20/2012 11:49:45 PM Specifically on the Long Filter, I have a couple questions about your Stratasearch results. 1. There are 14 years in the period but there are only 12 winning years displayed. Where are the other 2 years? 2. Same for the months, things aren't adding up. 3. The best return is 105.52%. Seems like there might be some funny business in the results. Did you validate the extreme cases. Could this be a stock split? 4. The worst year return was 0%, which year? 5. There is "interest" included in the profit numbers, where did that come from? ++++++++++++ 1. There are 13 years, 12 winning and 1 losing. This is because the data starts on 12/31/1999 so 1999 is counted as a year even though it is not used. 2. same with months 3. Don't know. Most likely a strong gap up, but even so I doubt it changed the overall numbers all that much since there were 1857 trades. 4. Not really relevant given the overall performance, IMO. 5. The interest comes from having your trading capital mostly in an interest-bearing money market account. I have set this at 1% per annum, which really underestimates most of the actual MM interest rates during the testing period. |
| mmaurice 51 posts msg #104567 - Ignore mmaurice |
1/20/2012 11:55:34 PM Wow, quick reply, I like it :) I checked your personal site and couldn't find where you are tracking this? Are you live trading? To add some value, I have found a good way to check for the gaps at the open on Monday is using a Google Docs sheet. Copy the symbol list in and then use the googlefinance commands to get previous close (closeyest) and todays open (priceopen). I calc the gap percent in another column and use a conditional filter to highlight the winners. |
| novacane32000 331 posts msg #104577 - Ignore novacane32000 |
1/21/2012 7:07:17 PM Kevin Is there a code you can use in StockFetcher to create a watchlist filter to track stocks that have gapped more than 2%? |
| unbias123 9 posts msg #104583 - Ignore unbias123 |
1/21/2012 10:03:48 PM Hi Kevin As always thank you for Great Systems both long & short. One thing I notice that in both systems average loss per trade is substantially higher than the average profit amount. What is your thought about that i.e stop loss etc. Your help is always appreciated. Thx |
| tomm1111 202 posts msg #104584 - Ignore tomm1111 |
1/21/2012 11:09:49 PM Kevin, Impressive equity curves on both the long and short version. The criteria is simple which is always best. Did the equity curve charts include any out-of-sample testing? Tom |
| StockFetcher Forums · Filter Exchange · MONDAY GAP UP AND GAP DOWN TRADING SYSTEMS | << 1 2 3 4 5 ... 14 >>Post Follow-up |