| StockFetcher Forums · Filter Exchange · FUN with Guppys ... a different perspective ! | << 1 2 >>Post Follow-up |
| alf44 2,025 posts msg #117685 - Ignore alf44 modified |
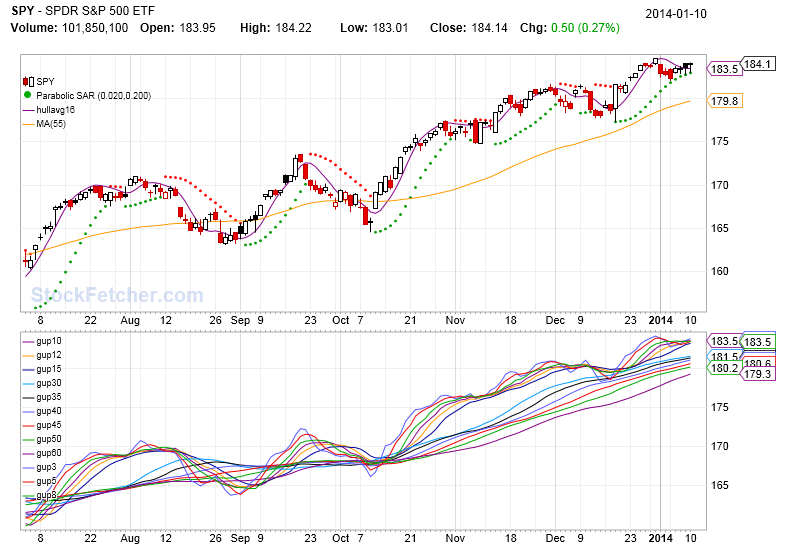
1/10/2014 4:54:17 PM . ............................................ Somewhere ... Over The Rainbow ... "GUPPYS" Fly !  From Investopedia : An indicator used to identify changing trends. The technique consists of combining two groups of moving averages with differing time periods. One set of moving averages in the Guppy Multiple Moving Average (GMMA) has a relatively brief time frame and is used to determine the activity of short-term traders. The number of days used in the set of short-term averages is 3, 5, 8, 10, 12 & 15. The other group of averages is created with extended time periods and is used to gauge the activity of long-term investors. The long-term averages use periods of 30, 35, 40, 45, 50 & 60 days. . |
| duke56468 683 posts msg #117689 - Ignore duke56468 |
1/10/2014 8:12:34 PM another one not sure where I got it. |
| alf44 2,025 posts msg #117691 - Ignore alf44 modified |
1/10/2014 8:45:54 PM . ... over the years at SF ... there have been MANY variations of "Guppy Multiple Moving Averages" ... presented here ! I know ... because I have posted "MANY" of them !!! MOST (If not all) of them ... have been displayed in the way you have displayed them ... that is ... ON THE PRICE PLOT ! YAWN !!! ----- What I have done here ... and ... THE PURPOSE OF THIS THREAD ... ... is to present the idea of "GUPPYS" ... with a "DIFFERENT PERSPECTIVE" !!! To display "the colorful & cute lil guppys" ... completely ... and ... separately... from the "price plot" !!! .. |
| alf44 2,025 posts msg #117692 - Ignore alf44 modified |
1/10/2014 11:24:16 PM ... Oh... and by the way ... I added a 16 period Hull Moving Average (and some other stuff) ... on the price plot at "no xtra charge" !!! Just sayin' . |
| alf44 2,025 posts msg #117709 - Ignore alf44 modified |
1/12/2014 2:06:44 AM . ..............................................Low Spark . |
| bert123 56 posts msg #117715 - Ignore bert123 |
1/12/2014 11:36:19 AM In case anyone is interested, Dave Mason, former member of Traffic, is currently touring the US featuring songs fromTraffic. |
| alf44 2,025 posts msg #117716 - Ignore alf44 |
1/12/2014 4:38:59 PM . ... love Dave Mason ... but, without Stevie Winwood on keyboards and vocals ... it just ain't Traffic ! . |
| scott111552 173 posts msg #117720 - Ignore scott111552 |
1/12/2014 9:58:13 PM ....was fortunate enough to catch Dave Mason as a member of Ringo Starr's All-Star Band....superb show!! |
| bert123 56 posts msg #117722 - Ignore bert123 |
1/13/2014 12:49:26 AM Scott: Dave is also great solo - see him if you get the chance - he must be close to 70 but still brings it. Alf: Concerning taste, there is no dispute. |
| push5280 201 posts msg #117757 - Ignore push5280 |
1/15/2014 12:57:07 PM Is there a way to change the colors of the lines? I think the the change in trends would be much easier to identify if all of the short term averages were black and all the long terms were red, rather than the 5 or 6 colors that SF uses and 2 ma's use the same color line. QA little confusing on some charts |
| StockFetcher Forums · Filter Exchange · FUN with Guppys ... a different perspective ! | << 1 2 >>Post Follow-up |