| StockFetcher Forums · Filter Exchange · Bottom Filter | << 1 2 3 4 >>Post Follow-up |
| Mactheriverrat 3,178 posts msg #159125 - Ignore Mactheriverrat |
5/26/2022 10:37:26 PM SPY broke above downtrend channel today. 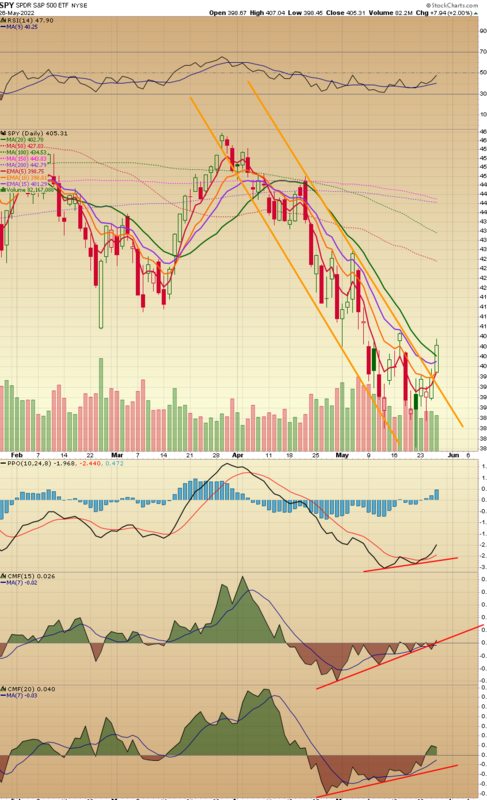 |
| Mactheriverrat 3,178 posts msg #159129 - Ignore Mactheriverrat |
5/28/2022 1:18:05 PM SPY Broke out of downtrend channel . Future resistance line in red. 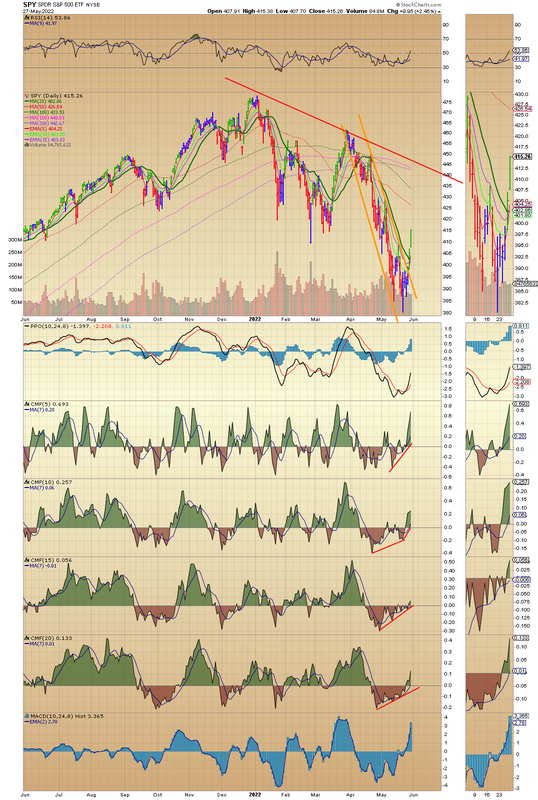 |
| marine2 963 posts msg #159130 - Ignore marine2 modified |
5/28/2022 2:05:02 PM What do you think is the % of Spy rise? Looks like a two week or less rise before worries of hitting the resistance. What say you? |
| Mactheriverrat 3,178 posts msg #159131 - Ignore Mactheriverrat |
5/28/2022 7:51:58 PM Well not really much of a percentages person. The red line is a resistance line. I would be watching the PPO 10,24 ,8 ( used for momentum strength which is a little faster than the default 12,26,9) and all 4 CMF's for buying or selling pressure. Who know's if the can break a confirmed break above it. |
| Mactheriverrat 3,178 posts msg #159132 - Ignore Mactheriverrat modified |
5/28/2022 8:21:46 PM This is the full version PDF 12 page strategy of "Double-Bottom Confirmation Strategy" from trader's magazine. I kind of tweaked a little bit using the PPO for momentum and 4 different CMF 's with 7 day moving average. I use the 7 day moving average as it shows a uptrend . I then draw a trend line on the CMF's to show a uptrend in buying pressure. My add of a Macd histogram with a 2 day moving is just a extra add I put in as for show strength trend. But to each their own. Full Double-Bottom Confirmation Strategy 12 page PDF file I use on my filter's a Price cross ma 20 . I then look at all CMF's seeing if they are trending up or near a cross of the CMF 0 line. Using the PPO as momentum strength. It doesn't have to be a Full Double bottom to use these indicator's . The EMA 10 cross the MA 20 show that strength is crossing over to the Bullish side of the 20 day moving. |
| StockFetcher Forums · Filter Exchange · Bottom Filter | << 1 2 3 4 >>Post Follow-up |