| StockFetcher Forums · Filter Exchange · BUYING THE DIP | << 1 2 3 4 5 ... 8 >>Post Follow-up |
| Kevin_in_GA 4,599 posts msg #113409 - Ignore Kevin_in_GA |
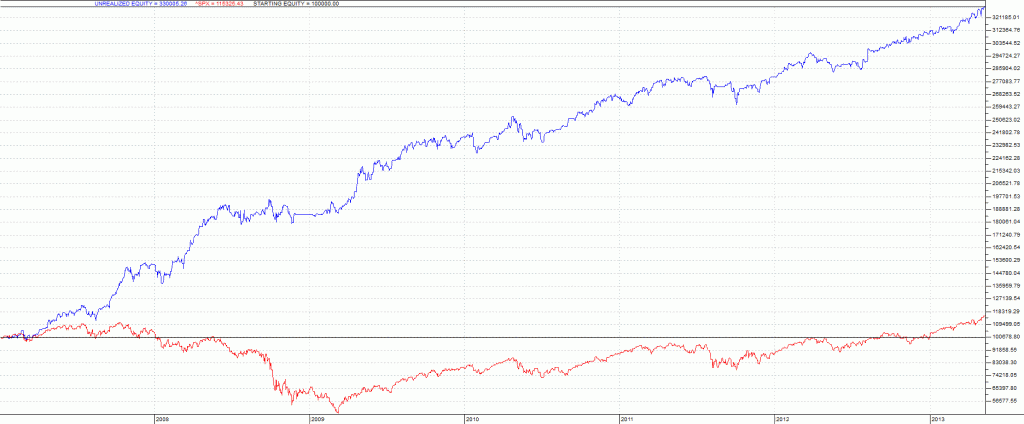
5/15/2013 10:22:44 AM We all have heard the adage "buy the dip", but what exactly is a "dip"? Most people would agree that a "dip" is a short term drop in a stock's price within a longer term upward trend in stock price. You are buying a pullback within a longer upward trend. But I may look at a stock chart and see a buyable dip when others would think that no dip had occurred. So how does one figure out what a good "dip" is, when to buy it, and when to sell? Last night I decided to play around with Stratasearch and see what I could do to define this mathematically, and to identify dip patterns that reliably generate profits. My starting thesis was that a "dip" is a short term period (X1 days) where the rate of change is negative within a longer term period (X2 days) where the rate of change is positive. I also think that "buying the dip" should require that the stock be above its 200-day moving average, as this is also a good indicator of general health of a stock. Mathematically that entry code in SF looks something like this: ROC(X1,1) crossed below Y1 ROC(X2,1) above Y2 close above MA(200) X1 = 1, 3, 5, 7, 9, 11 Y1 = -2, -4, -6, -8, -10 X2 = 20, 40, 60, 80, 100 Y2 = 5, 10, 15, 20, 25, 30, 35, 40 That covers the first half (the "buy the dip") but we still need to decide on an exit that generates reliable profit. Generally you can simply look again at the short term ROC and sell when it rises above a certain level. That exit looks like this: ROC(X1,1) above Y3 where Y3 is 0, 2, 4, 6, 8, 10 7200 variations of a common trading theme - one that for most people is a gut decision rather than a statistical one. Running all these combinations only took about an hour to do on the S&P 500 for the period 1/2/2007 until 5/10/2013. I like to keep the backtest to no more than about 5 years to avoid survivorship bias, and this period also encompassed the 55% drop the S&P took in 2008/2009. The result? Most combinations outperformed the S&P 500 by a wide margin, giving credence to the basic approach. Not a surprise for most folks here, I would guess. Among the best combinations was the following: The exit is "ROC(7,1) above 2". The backtest both bought and sold at the open of the day following the signal being generated. I ranked the order of stock selection by lowest ROC(7,1) first - essentially buying the biggest dips for that day. Here are the equity curve and system performance stats: 

Not bad - the Sharpe ratio (annualized) is 1.73 and the win rate is 72%. And you made 30+% a year during an absolutely horrible period for many traders. |
| johnpaulca 12,036 posts msg #113419 - Ignore johnpaulca |
5/15/2013 1:05:36 PM That equity curve is a thing of beauty....good job!!! |
| scott111552 173 posts msg #113424 - Ignore scott111552 |
5/15/2013 1:33:57 PM You've done it once again, Kevin....great work and thanks for your generosity in sharing this with the SF community... |
| Kevin_in_GA 4,599 posts msg #113425 - Ignore Kevin_in_GA |
5/15/2013 1:45:13 PM That equity curve is a thing of beauty....good job!!! +++++++ For using only S&P 500 stocks and an average hold period of 8 days, it is pretty solid. This system is really designed for swing traders, and can basically be tweaked using limit orders instead of market orders to get a little more juice out of it. I like this current incarnation because it can be traded by almost anyone without much effort. All based on statistical probabilities. But you should see they day trading system I have been testing over the last few months ... now that equity curve would have you breathing heavy. |
| johnpaulca 12,036 posts msg #113427 - Ignore johnpaulca |
5/15/2013 2:01:35 PM looking forward to it (: |
| Kevin_in_GA 4,599 posts msg #113428 - Ignore Kevin_in_GA |
5/15/2013 2:11:37 PM Send me an email at my statisticalinvesting account and I'll send you some info. |
| jackmack 334 posts msg #113429 - Ignore jackmack modified |
5/15/2013 2:29:27 PM A thing of beauty indeed as johnpaul put it - well done and thank you for sharing. Cheers |
| Marcello 9 posts msg #113431 - Ignore Marcello |
5/15/2013 4:27:20 PM Kevin - you are a great help in my effort to increase my trading skills. I am trying to learn from your filters - and how you are thinking and building these filters. Wish I in some way could help you also.. Once again thanks Marcello |
| optionplayer333 801 posts msg #113434 - Ignore optionplayer333 |
5/15/2013 5:17:34 PM I would be glad to tell you which stocks to buy since I have inside info to every single stock> here are the one I would of given you the last 2 weeks> jcp at 16.30 nflx at 160 gmcr at 56 tsla at at 54 clf at 17.36 crus at 18 csco at 20.30 A at 41 goog at 777 pcln at 677 rax and vclk are at there bottoms I can give you cheap stocks if you want |
| mahkoh 1,065 posts msg #113435 - Ignore mahkoh |
5/15/2013 5:42:30 PM Kevin, Did you run an optimization for number of open positions held? |
| StockFetcher Forums · Filter Exchange · BUYING THE DIP | << 1 2 3 4 5 ... 8 >>Post Follow-up |